


Multiple-criteria decision analysis
When a problem gets complicated, it helps to lay it out clearly and look at every criterion that matters to you. Decisions made that way are better thought out, and you are far more likely to be happy with how they turn out. In everyday life we usually weigh things in our head, almost without noticing, and we live with whatever follows from those quick gut calls. That is fine for small stuff. But when a lot is riding on the choice, it pays to put every criterion on the table and look at it in the open. That is what Multiple-criteria decision analysis (MCDA) is for. It gives you a clear way to weigh several criteria that pull against each other. Price is almost always one of them, and quality is usually another, and the two are often at odds. The cheaper option is rarely the best made.
Think about buying a car. You want a low price, good gas mileage, plenty of room, and a brand you trust. No single car wins on all four. MCDA is how you trade them off on purpose instead of just hoping for the best.
This tutorial walks you through the main ideas of MCDA using the Decision Tree software.
Multiple Objectives in a Decision Tree
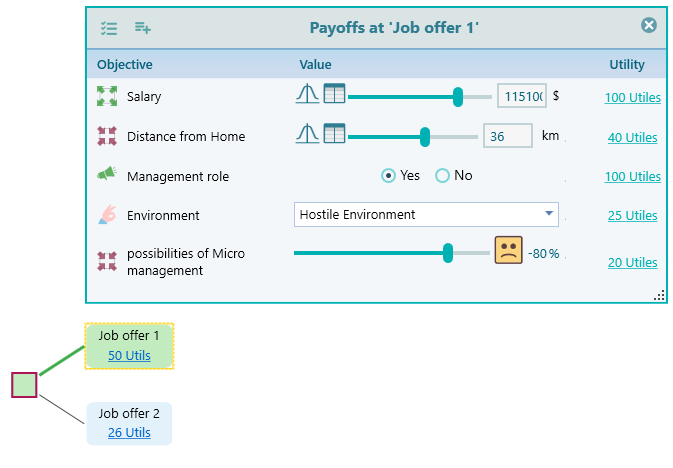
In a decision tree, the payoff is whatever you are trying to get out of the decision. Say you are weighing a few job offers. You might care about more than one thing at once, for example:
- Get the highest salary
- Keep the commute short
- It has to be a management role
- Avoid getting micro-managed
and so on.
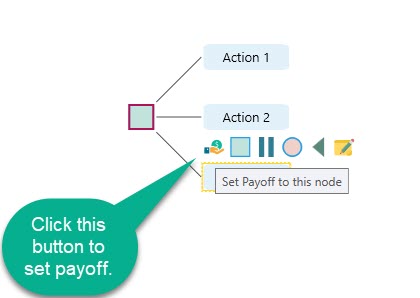
That is several objectives, not one. So when you build the tree and put a payoff on a node, the payoff has to say something about each of those objectives. Most snap decisions have a single objective, like "make the most profit" or "spend the least money," so they rest on one number: dollars. But a good decision usually has more going on. You spell out the objectives that matter, then state the payoff in terms of the criteria that come from them. The Decision Tree software is built for exactly this. It lets you set up several objectives and enter a payoff for each one, as shown below.

Criteria vs. Objectives
So what is a criterion, and what is an objective? An objective is the thing you want, said in plain words. A criterion is the scale you measure it on. Take the objective "make the most profit." The criterion behind it is "Profit." When you set the payoff on a node, you say how much profit you expect from that outcome, in dollars or whatever currency you use.
The Decision Tree software lets you write down your objective in plain language. It then pulls the criterion out of that objective and asks you to set a payoff for it.

Setting up Criteria
When you open the Decision Tree software, this is the first screen you see. It is your starting point, so take a moment to look it over before you do anything.
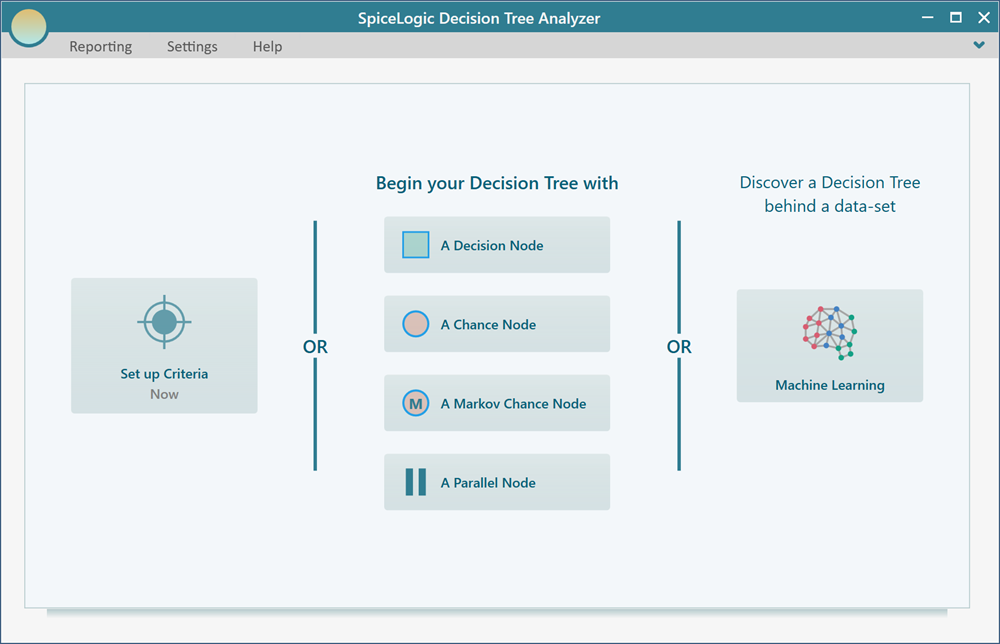
You have two ways to go from here. You can jump straight into building the tree by clicking one of the buttons on the right, for example "A decision node." Or you can click "Set up Criteria" to define your criteria first. If you build the tree first, that is fine. You can set up the criteria later, any time, by clicking the payoff button on a node.
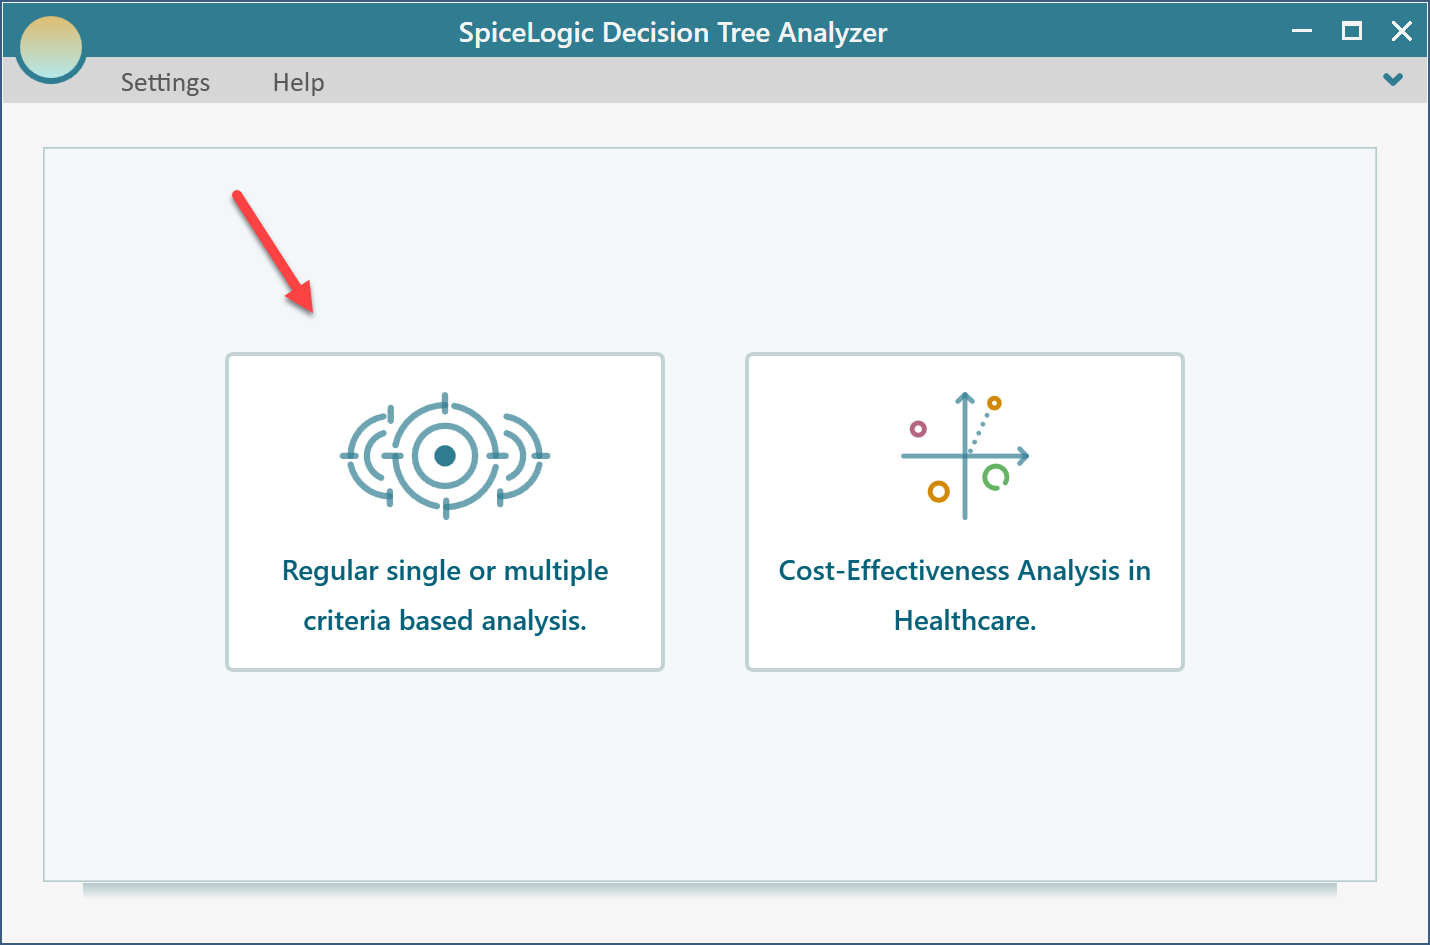
If you click "Set up Criteria," you will see the screen below. Click the first button, "Regular single or multiple criteria..."
That brings up the following screen.
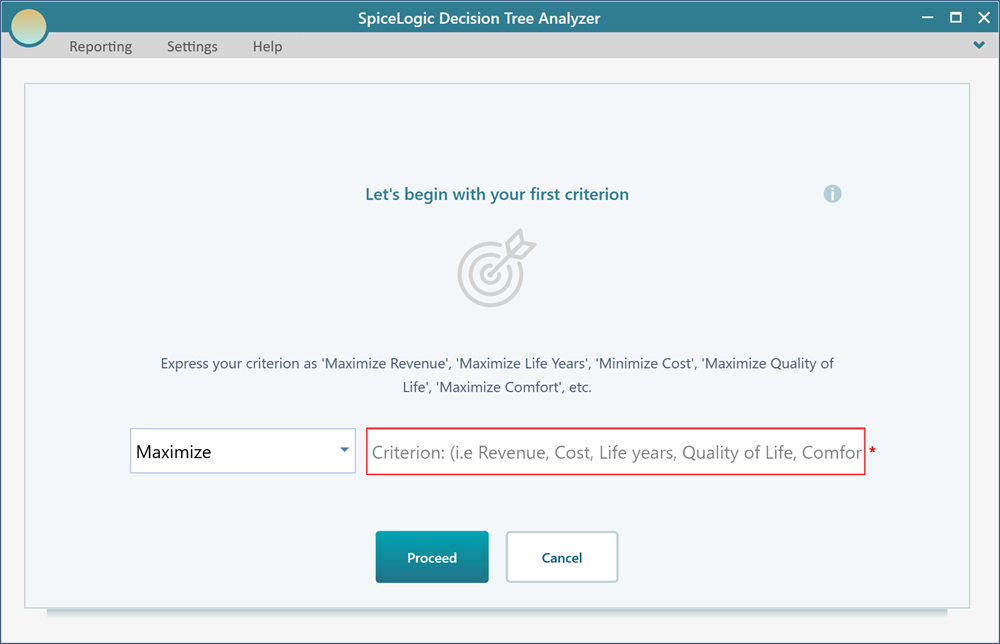
If you chose to build the tree first, then the first time you click the Payoff button on a node, you land on this same objective start screen. So it is your call. Start with your objectives before you draw the tree, or draw the tree first and work out your objectives later. Both paths end up in the same place.
You only need criteria when you are ready to set a payoff. Until that moment, you can keep building the tree without naming a single objective.
The trick is to word each objective so the criterion behind it is obvious. Word them like this:
- Maximize Sale
- Minimize Cost
- Minimize Time
and so on.
Word them that way and the criteria fall right out: "Sale," "Cost," "Time," "Distance," "Neighborhood is good," and the like. The verb (maximize or minimize) tells you which way is better, and the noun is the criterion you will score.
On the objective start screen, pick the right objective term from the drop-down box and type the criterion in the textbox, as shown below.
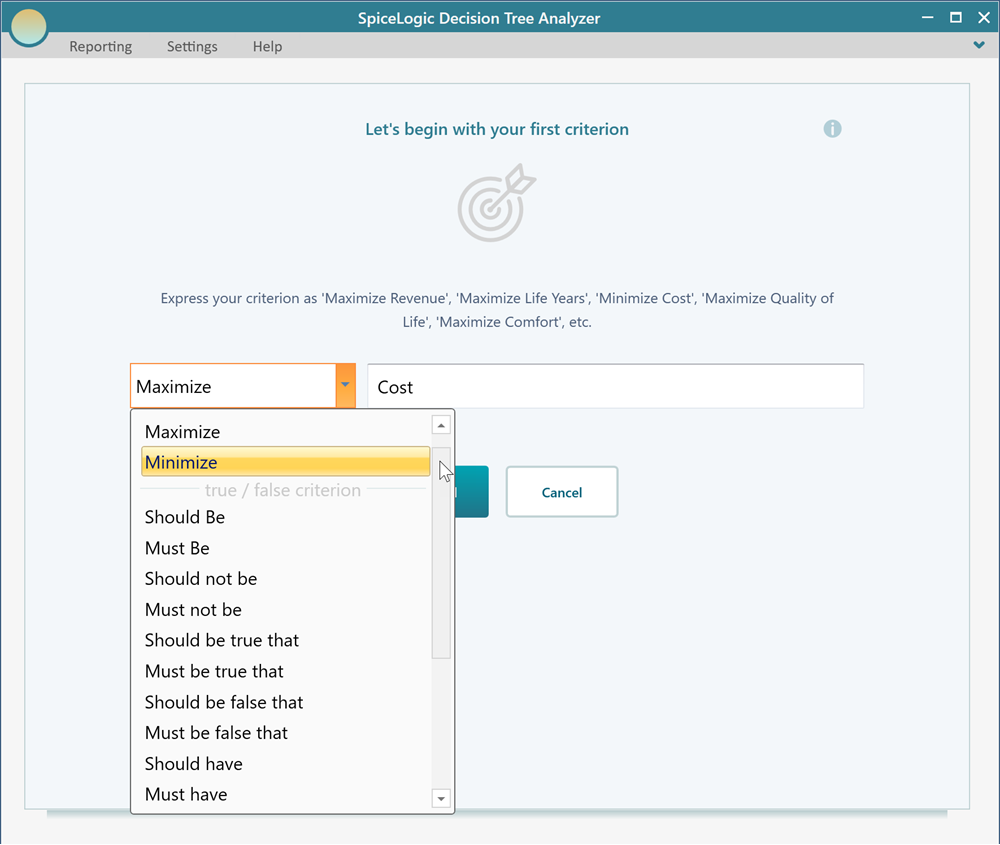
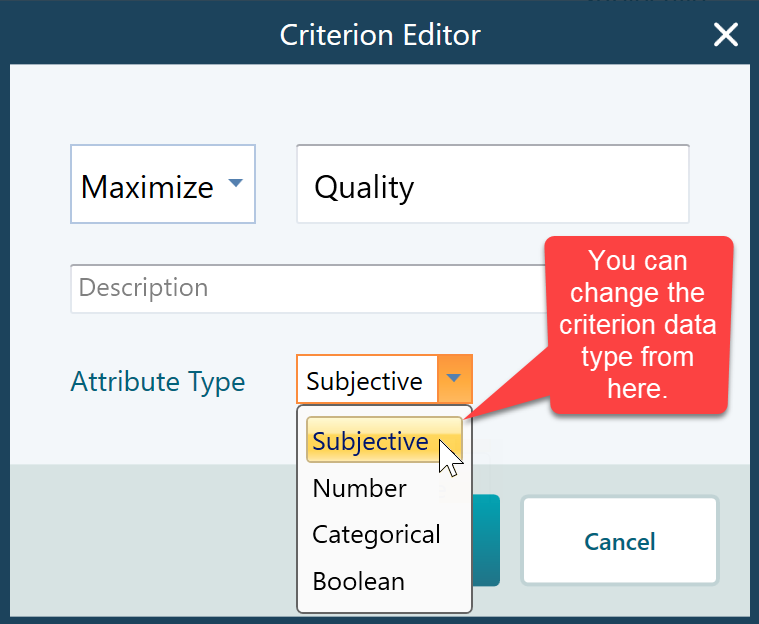
Once you have typed the criterion, click "Proceed." You may then be asked what type of objective this is. It is simply asking whether the objective is a Number type or a Subjective type.
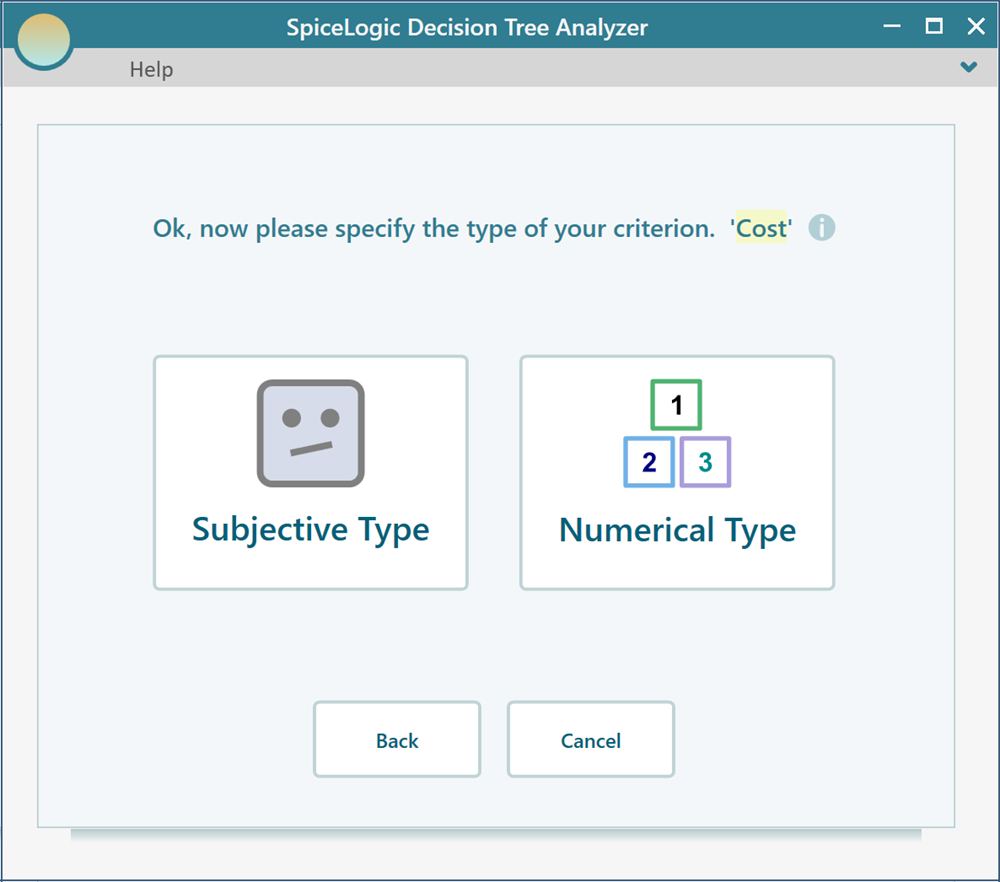
There is a good reason for that question. If the payoff is something subjective, like beauty, comfort, or satisfaction, or if you just want to enter the payoff straight as a utility value (even for money), pick the Subjective type. Choose Subjective and you are done. No more questions. But if you pick the Number or Monetary type, you may be asked for a few more details, such as the smallest possible value, the largest possible value, the unit, and so on. We cover the criterion data types and how to use them in full on separate pages.

How the Multi-Criteria Payoff is Calculated
With a single objective, you have a single criterion for the payoff. If your objective is "make the most sales," then setting the payoff on a node is easy. You type the sale amount, maybe in dollars. But with more than one objective, you need a way to roll all the criteria into one number, and that is harder. You cannot add apples to oranges. In the same way, you cannot just add up payoffs that are measured on different scales.
Here is an example. You are picking a house to buy, and you have two objectives:
- Keep the distance from work short
- Get the most floor area (in square feet)
Say for a house called "house A" the distance from work is 10 km, and the area is 1500 square feet. You obviously cannot add 10 km to 1500 square feet and get something meaningful, right? So you convert each one onto a common utility scale. Say 10 km works out to a utility value of 0.7, and 1500 square feet works out to a utility value of 0.4. Now say you care about area three times as much as the commute. On a scale of 0 to 1, that gives area a weight of 0.75 and the commute a weight of 0.25, because 3 to 1 is the same as 75% to 25%.
Now you can score house A with this formula:
Value of an Action = Sum of (Objective Weight x Utility value for that objective)
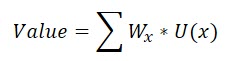
Using that formula, the overall utility value for house A is:
= weight of area x utility value of area + weight of distance x utility value of distance
= 0.75 x 0.4 + 0.25 x 0.7 = 0.475
You work out the overall utility value for every other house the same way, then pick the one with the highest score. So if house B comes out at 0.52, it beats house A, even if house A felt nicer at first glance.
So every payoff has to be turned into a utility function. Either you define the utility function yourself, or the software quietly builds a risk-neutral one for you. Once the utility functions are set, you need a way to add them together using a weight for each objective. The weights come from the priorities you set. A weight is a fraction between 0 and 1, and all the weights add up to 1.
To work out the overall utility value for a node, you first need to settle the weight for each objective.
There are two ways to do this. One way is to compare your objectives two at a time and let the software solve the matrix for its Eigenvector, using the same math behind the Analytic Hierarchy Process. The other way is to set the weights yourself, directly. Pairwise comparison is easier when you are not sure of the exact numbers. Setting them directly is faster when you already know how much each objective matters.

Evaluating weights by pairwise comparison
Right, so once you have picked the type of objective, the software asks whether you have another objective to add.
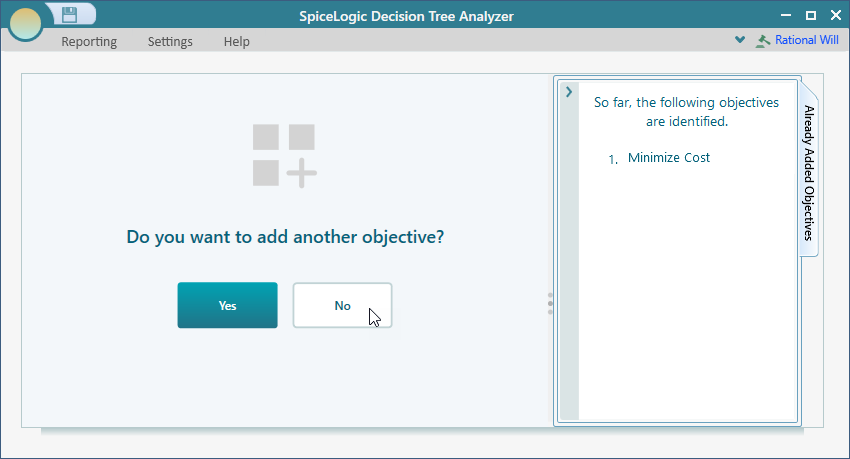
Answer "No" and it stays simple. In the decision tree you enter the payoff against that one criterion. But if you have more than one objective, answer "Yes." You then add the next objective the same way you added the first. When you have entered every objective, answer "No" on the screen shown above. That takes you to the pairwise comparison window shown below.
Pairwise Comparison Explained
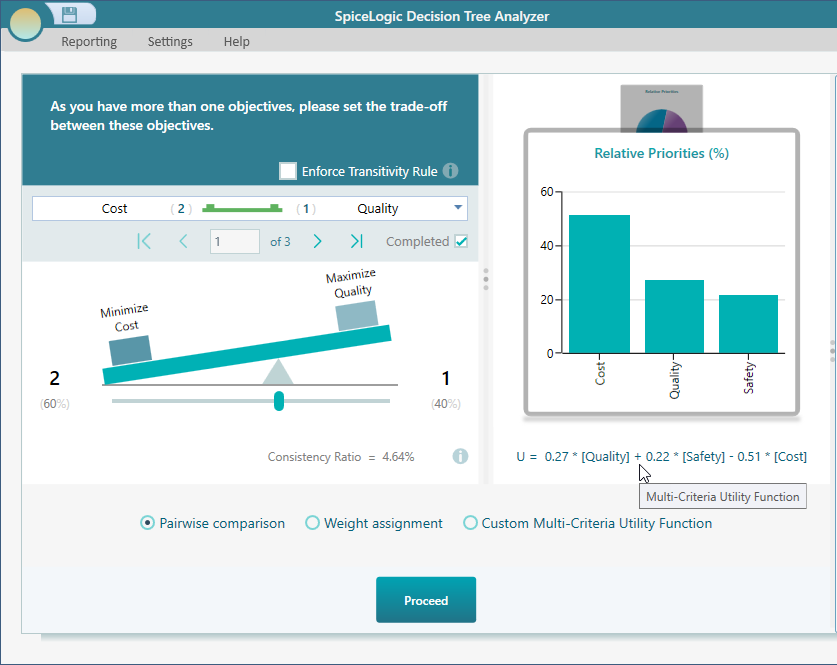
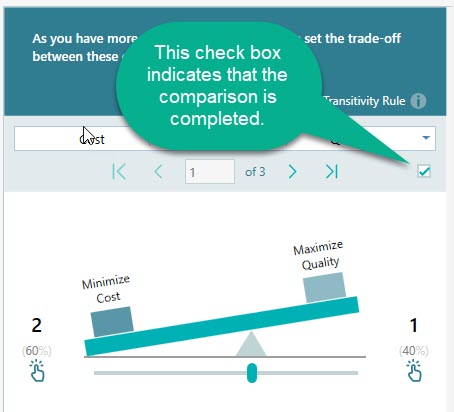
As you can see, it is an easy screen to work with. You set how strongly you prefer one objective over another using the weight slider. For example, if keeping cost down matters to you twice as much as raising quality, you set the slider as shown below. You only ever judge two objectives at a time, which is far easier than trying to rank everything at once.
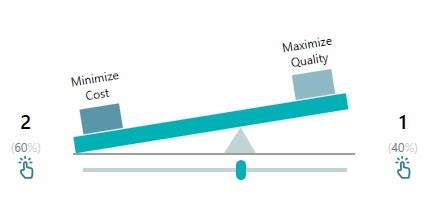
You work through every trade-off this way, one pair at a time. As soon as you move the slider on a pair, the checkbox below gets ticked. That tells you the comparison is done, so you can see at a glance which pairs you still have left.
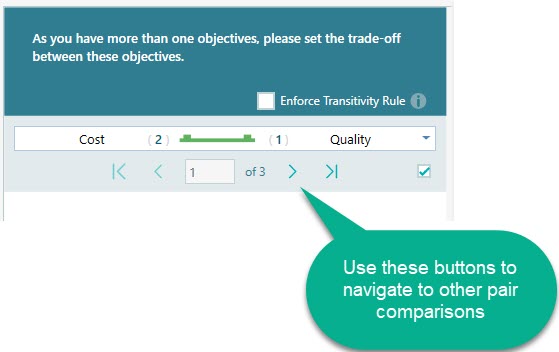
That tick is set automatically when you move the slider. But if you truly want the two objectives to count equally (1 to 1), you can tick the checkbox yourself to mark the pair as done. To move to the next pair, use the navigation buttons on the toolbar.
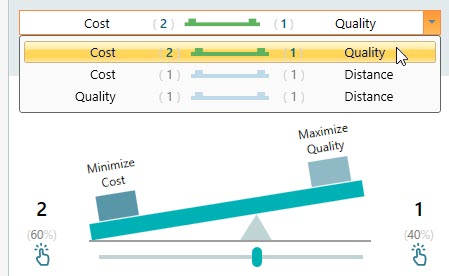
You can also open the drop-down to jump straight to any pair. This is handy when you have a lot of objectives and want to go back and fix one comparison without clicking through all the rest.
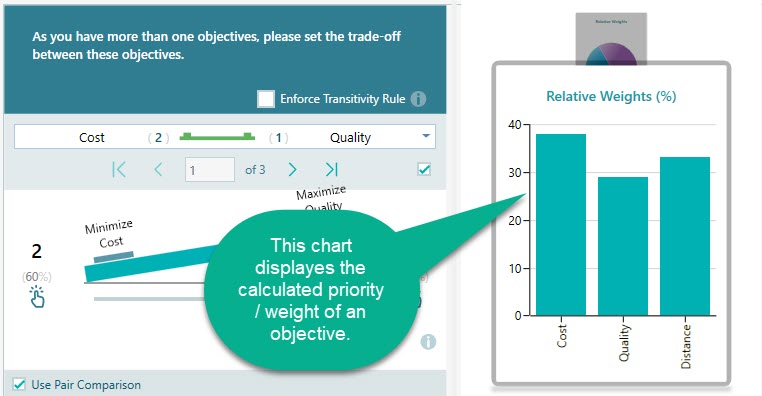
The weight for each objective is worked out with the same Eigenvalue method used by the Analytic Hierarchy Process. The resulting weights show up in the chart in the same panel, as shown below, so you can see right away which objectives came out on top.
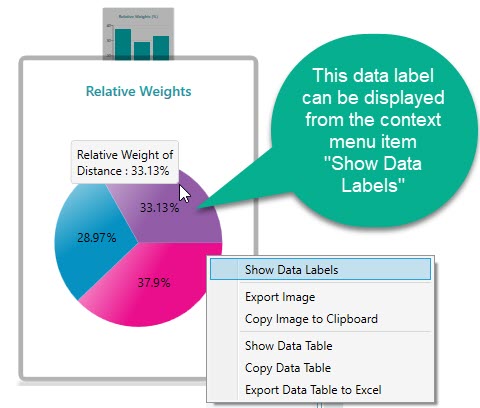
There is a pie chart too, in the same carousel, as shown below. It shows the same weights as a slice for each objective, which makes the split easy to read at a glance.

Consistency Ratio Metric
The Consistency Ratio tells you how much you have broken the transitivity rule. Here is what that means. Suppose you like an apple twice as much as an orange, and an orange three times as much as a banana. To stay consistent, you should then like an apple six times as much as a banana. If your apple-versus-banana choice does not line up with that, your preferences are inconsistent. The Consistency Ratio measures how far off you are. The bigger the number, the more your answers contradict each other. When your preferences line up perfectly, the number is 0.
Look at the number shown below the comparison weight slider.
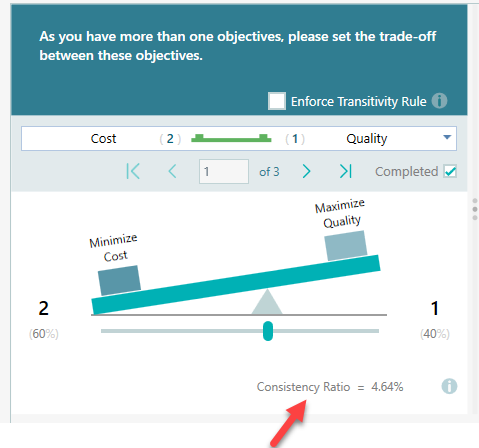
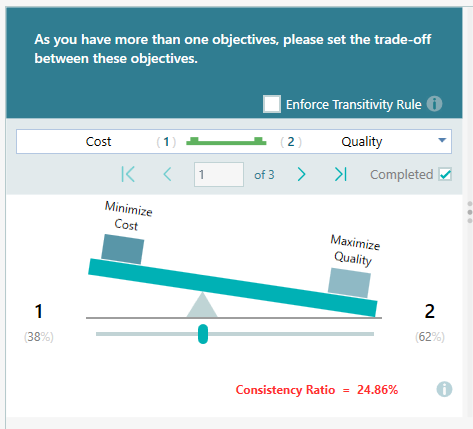
Thomas L. Saaty, who created this method, recommends keeping the Consistency Ratio at or below 10%. So if you see it climb above 10%, it is worth going back over your judgments. A high number usually means one comparison clashes with the others, so fixing a single pair often brings it back down. When the ratio goes over 10%, the software flags it in bold red, as you can see on this screen.

Enforce Consistency (Transitivity Rule)
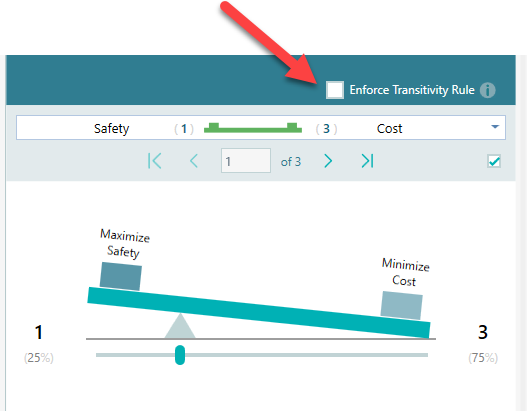
The software can also keep all your pairwise comparisons consistent for you. Instead of asking you to compare apple-orange, apple-banana, and orange-banana, it asks for only two: apple-orange and apple-banana. From those it works out orange-banana on its own. This cuts the number of comparisons from 1/2 x n x (n - 1) down to just (n - 1). That difference adds up fast. With 5 objectives you go from 10 comparisons down to 4. With 10 objectives you go from 45 down to 9. The more objectives you have, the more comparisons you skip, and the more time you save. To turn this on, tick the Transitivity rule checkbox. The moment you do, you will see the number of pairs to compare drop sharply.

Setting Objective weights directly
Sometimes you just want to move fast and skip the pairwise comparison, setting the weight for each objective by hand. You can do that by choosing the direct weight assignment option, as shown below. This is the better choice when you already have a clear sense of how important each objective is.
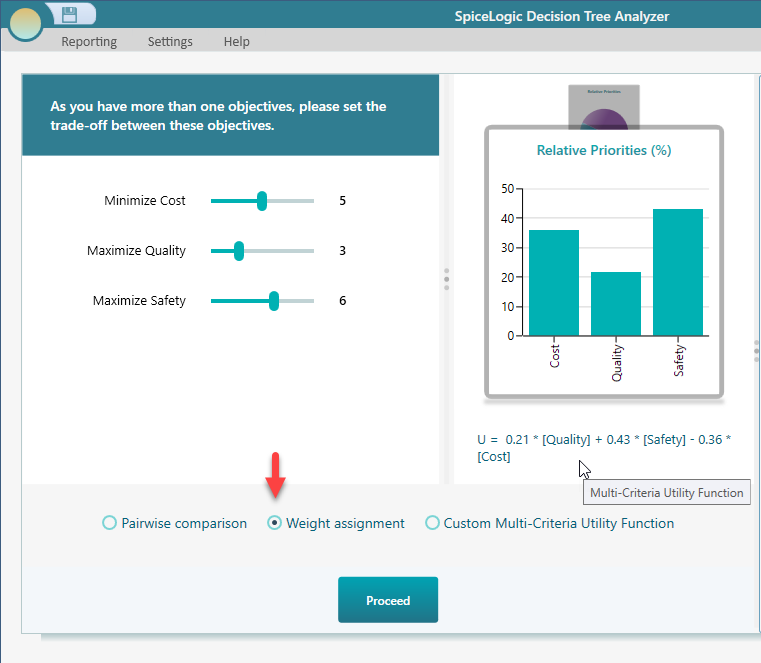
When you do, you get a panel listing your objectives, each with its own slider. Drag a slider to set how important that objective is. The slider runs from 1 to 9, and the software turns your settings into weights that add up to 1, like this:

For example, the three objective weights above work out as:
Weight of "cost" = 5 / (5 + 3 + 6) = 0.36
Weight of "quality" = 3 / (5 + 3 + 6) = 0.21
So each slider value is just divided by the total of all the sliders. That is why the weights always add up to 1, no matter what numbers you pick.

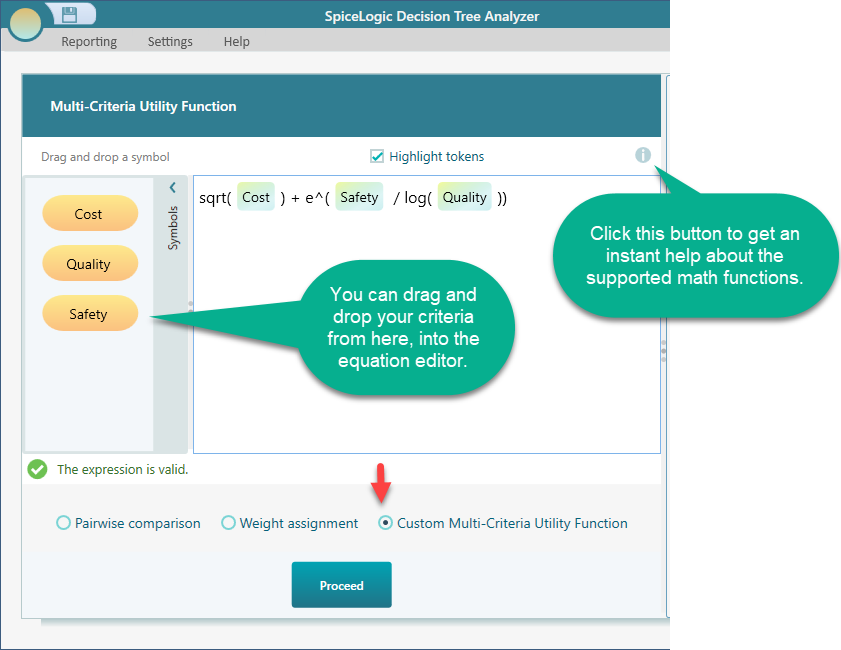
Using a Custom Expression for the Multi-Criteria Utility Function
You might want to write your own formula for the multi-criteria utility function, such as:
= 2 * [Quality] - 3 * [Cost] + 7 * [Safety]
or something more involved, like:
= sqrt( [cost] ) + e^( [safety] / log10( [quality] ) )
Yes, you can do that. Just tick the box labeled "Custom Multi-Criteria Utility Function," as shown below. This is for the cases where simple weights are not enough and you need the criteria to combine in your own way.
One thing to keep in mind. You can also model the utility function for a single criterion here, but this is not the best place to do it. It is better to build a richer single-criterion utility function from the objective editor, as explained on the Utility Function page.
This equation editor is a full-featured editor, and it should handle any math expression you need for a utility function.
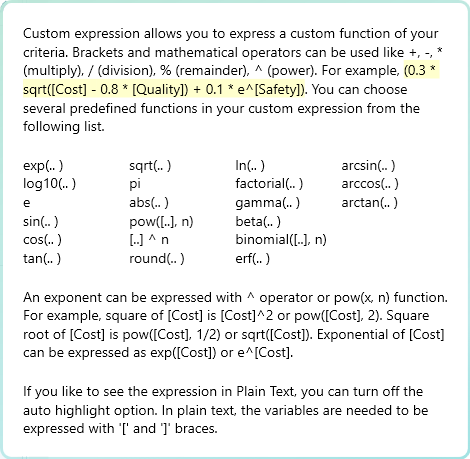
As you can see in the screenshot above, there is a help button that gives you a quick rundown of the math functions the editor supports, such as sqrt, log, and the like. Here is the popup that appears when you click it.

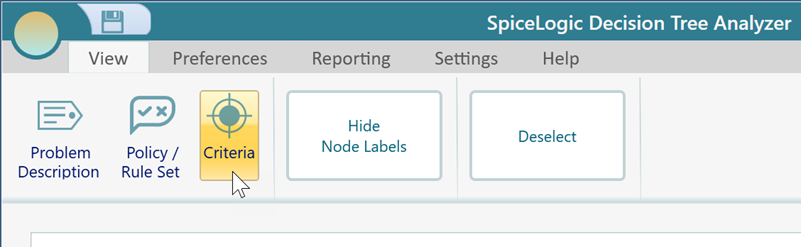
Managing Criteria
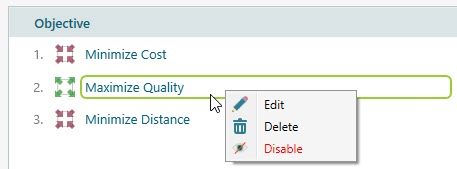
Once you have a list of criteria, you can return to the Criteria page any time from the Decision Tree window. Open the View tab on the Ribbon and you will find an "Objectives" button. Click it to go to the objectives page. This is where you go when you want to review your criteria, change one, or remove one you no longer need.
The criteria page shows the full list of your criteria. Double-click any one of them to open its editor. The editor you get depends on the data type of the criterion, so each type opens its own purpose-built editor. A Number criterion opens a different editor from a Subjective one, because they need different settings.

You can also right-click a criterion to open its context menu, where you will find Edit and Delete. Edit opens the same editor as a double-click. Delete removes the criterion for good, so use it with care.
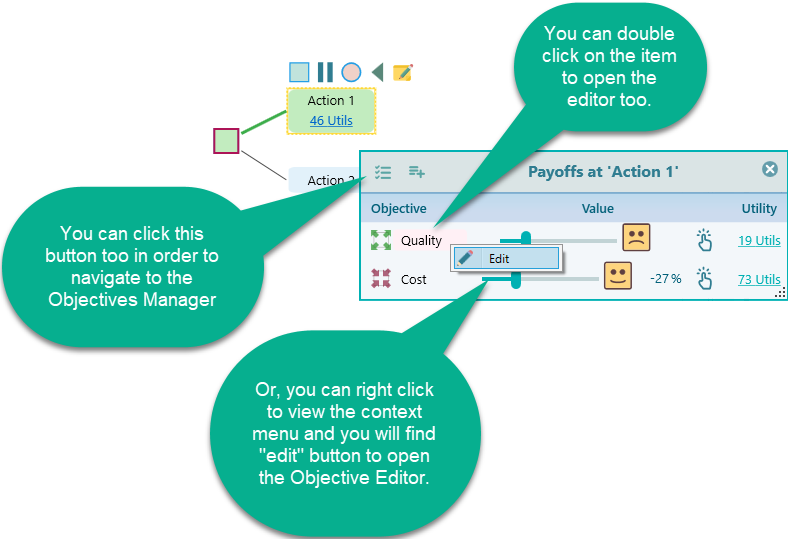
You do not have to go through the criteria manager. You can open a criterion editor straight from the Decision Tree payoff popup. The payoff popup lists the criterion values, as shown below, so you can fix a criterion right where you are setting the payoff.
Criterion Editor
As mentioned, the editor you see when you double-click a criterion depends on the objective data type. Below is the Criterion Editor for the Subjective type.
Disable a criterion
From the context menu you can also disable a criterion.

When you disable a criterion, it sits out of the calculation. This is handy for testing. You can ask "what if I drop this criterion, does the best choice change?" and then turn it back on afterward. For example, you could disable "price" to see whether the winner holds up on the other criteria alone. If you delete a criterion, it is gone for good. So disabling is the safe way to run a what-if check.
