


Custom Expression Editor
In several places, Rational Will lets you type your own expression instead of picking one from a fixed list. Two common spots are the Probability Distribution tool, where you can write a custom piecewise expression for your own density function, and the Utility Function editor, where you can shape a utility function in your own words instead of using a built-in curve.
This is useful when the standard choices do not quite fit your problem and you want full control over the math. Say the built-in normal distribution starts too early for you and you want the values to begin only at a certain point. You can write that rule yourself instead of forcing your problem into a preset.
Wherever this option shows up, you get the same custom expression editor. It looks like this:
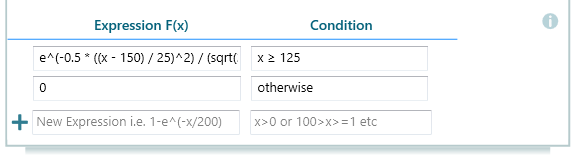
The expression in the screenshot above reads like a simple rule. When a certain condition is true, it uses one formula. When the condition is false, it uses another. Here is what it means:
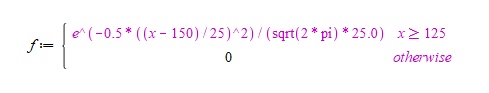
Explanation:
When x >= 125, f(x) = e^(-0.5 * ((x - 150) / 25)^2) / (sqrt(2 * pi) * 25) .
Otherwise, f(x) = 0.
In plain words: for any value of x that is 125 or larger, the function uses the normal (bell curve) formula centered at 150 with a spread of 25. For any value below 125, the function returns 0. That is how you build a piecewise function. You give one formula for one range of values, and a different result for the rest.
This kind of cutoff is handy in real cases. Imagine you are modeling a measurement that can never go below 125, like a sensor reading or a price floor. You want the bell curve above that point and nothing below it. The rule above does exactly that.
Quick Tip
You do not have to memorize the function names. You can see the full list of supported functions at any time by clicking the info button, shown below:
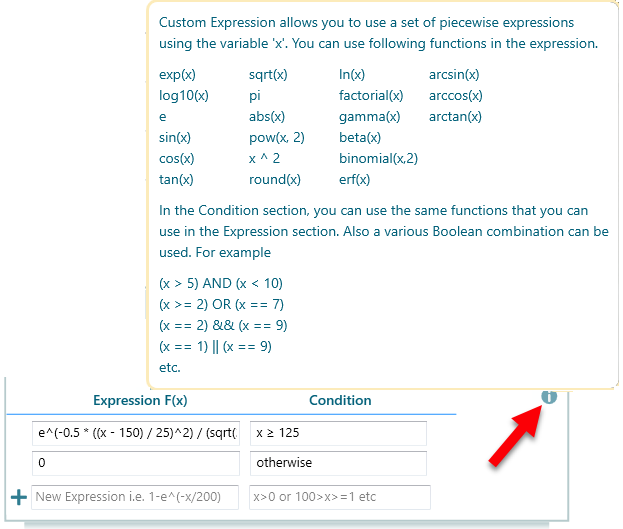
List of supported functions
| Supported Constants
Supported Operators
Boolean ExpressionsIn the condition part, you can use all the same functions listed above. You can also join several tests together with AND and OR. For example:
This is what makes a piecewise rule possible. The condition decides which formula runs, so you can set a clean range like the x >= 125 cutoff shown earlier. |