


Introduction to Utility Function
What is Utility?
Utility is the amount of satisfaction or benefit you get from something. If you buy a phone, eat a meal, or earn some money, the good feeling you get from it is its utility. Economists even gave this idea a unit and called it the "util".
Here is the catch. You cannot measure utility with a ruler or a scale. It is an abstract idea, and the numbers are relative. So if investment A has a utility of 100 and investment B has a utility of 150, you cannot say that B is exactly 50 percent better than A. The numbers only tell you that B is preferred to A. They do not tell you the exact ratio of how much happier B makes you.
In the Decision Tree software, utility is shown on a scale from 0 to 1. That is the scale most textbooks use, where 0 means no satisfaction and 1 means full satisfaction.

In the SpiceLogic Decision Tree software, every payoff is measured in utility. If you would rather work with a 0 to 100 scale instead of 0 to 1, you can switch it. Both scales mean the same thing, so pick whichever is easier for you to read. For example, a utility of 0.8 on the 0 to 1 scale is the same as 80 on the 0 to 100 scale.
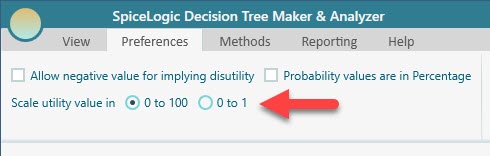
You can also use a negative number to show pain, discomfort, or dissatisfaction. Look at the same Ribbon panel in the screenshot above. There is a checkbox you can tick to say that a negative utility value means disutility, in other words a bad outcome instead of a good one.
What is a Utility Function?
A utility function turns a real-world value into a perceived value. In plain words, it turns a number into how much satisfaction that number actually gives you.
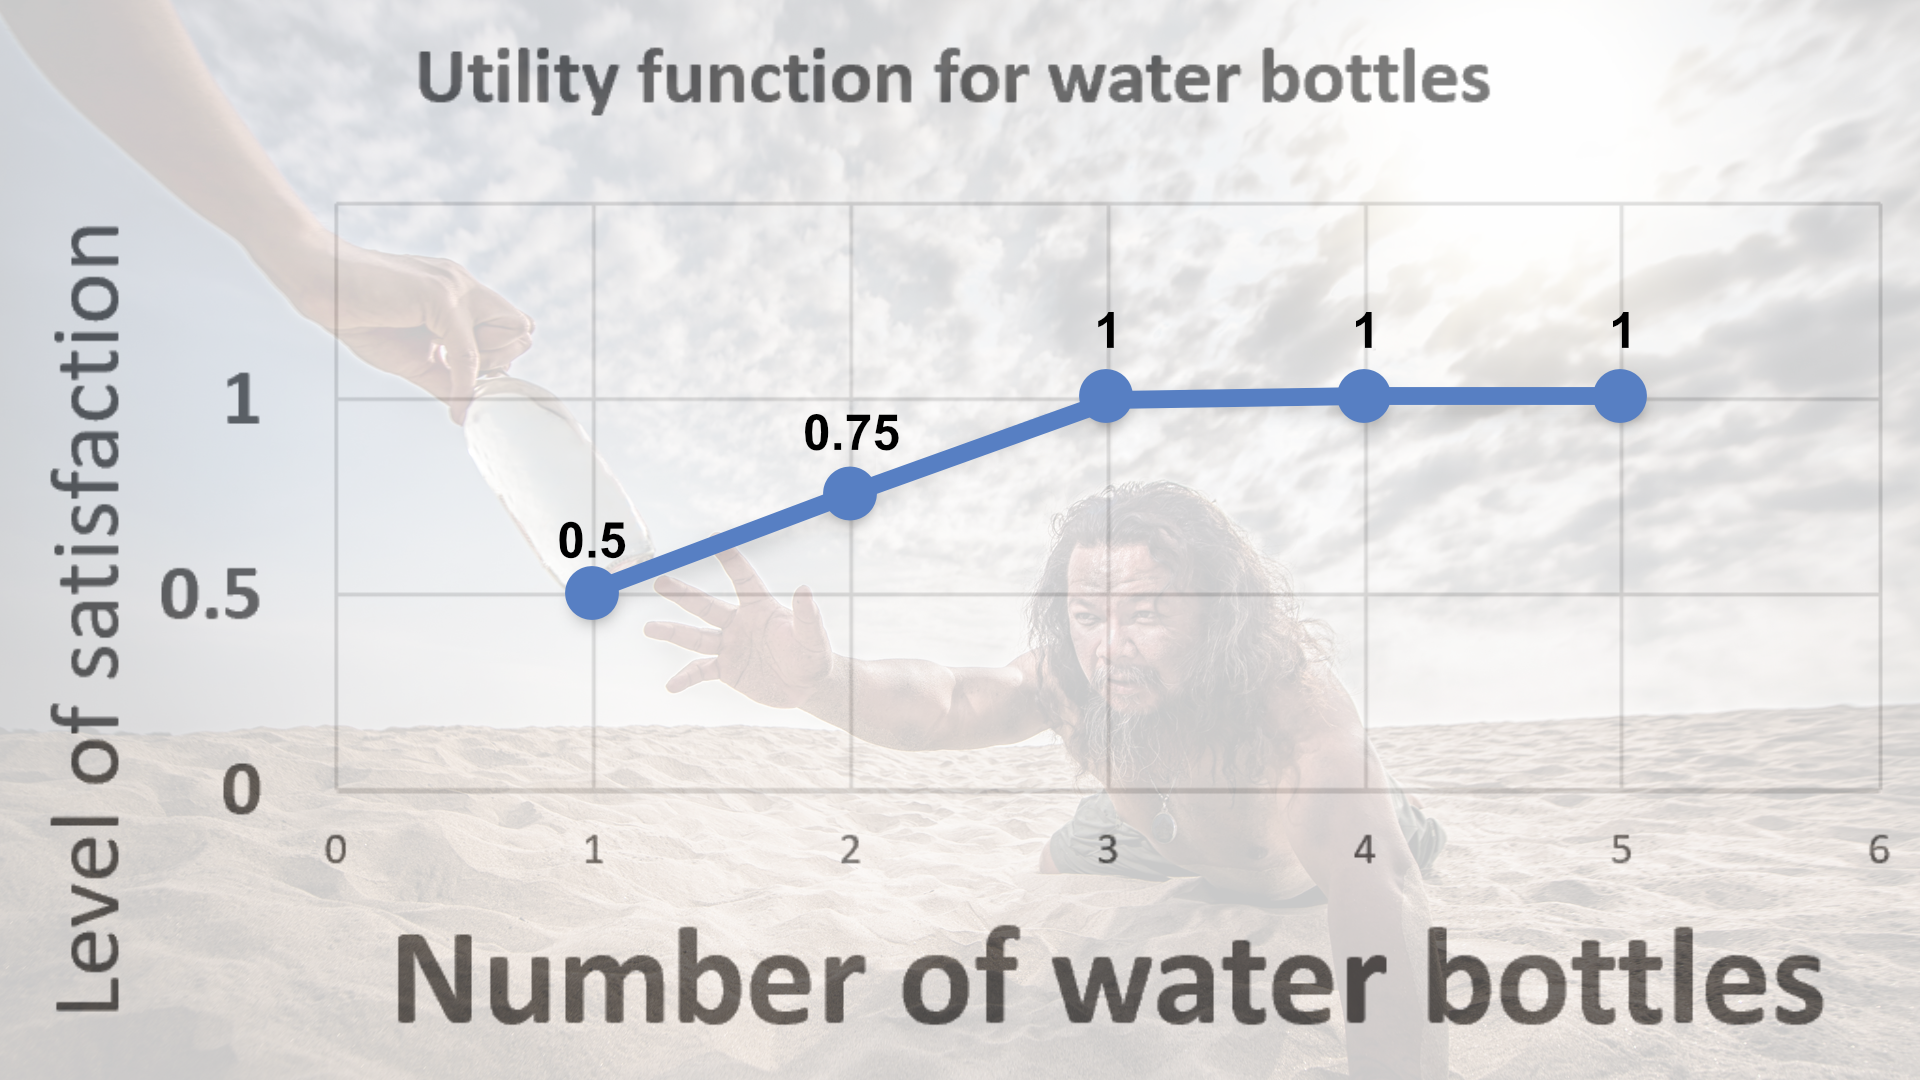
The key idea is that more is not always better. Picture yourself very thirsty. The first glass of water makes you happy. The second glass makes you even happier. But by the time you reach for the third glass, your thirst is gone, so that glass may give you little or no extra pleasure. The satisfaction you get from each extra glass keeps shrinking. That is exactly what a utility function captures.
If we say 0 means completely unsatisfied and 1 means fully satisfied, we can draw that idea like this.
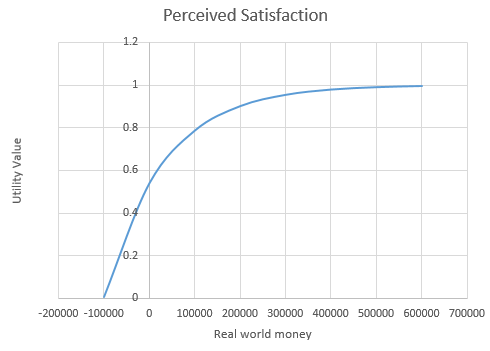
In economics, the same approach is used for money. A utility function maps how much money you gain to how satisfied that money makes you feel, like this.
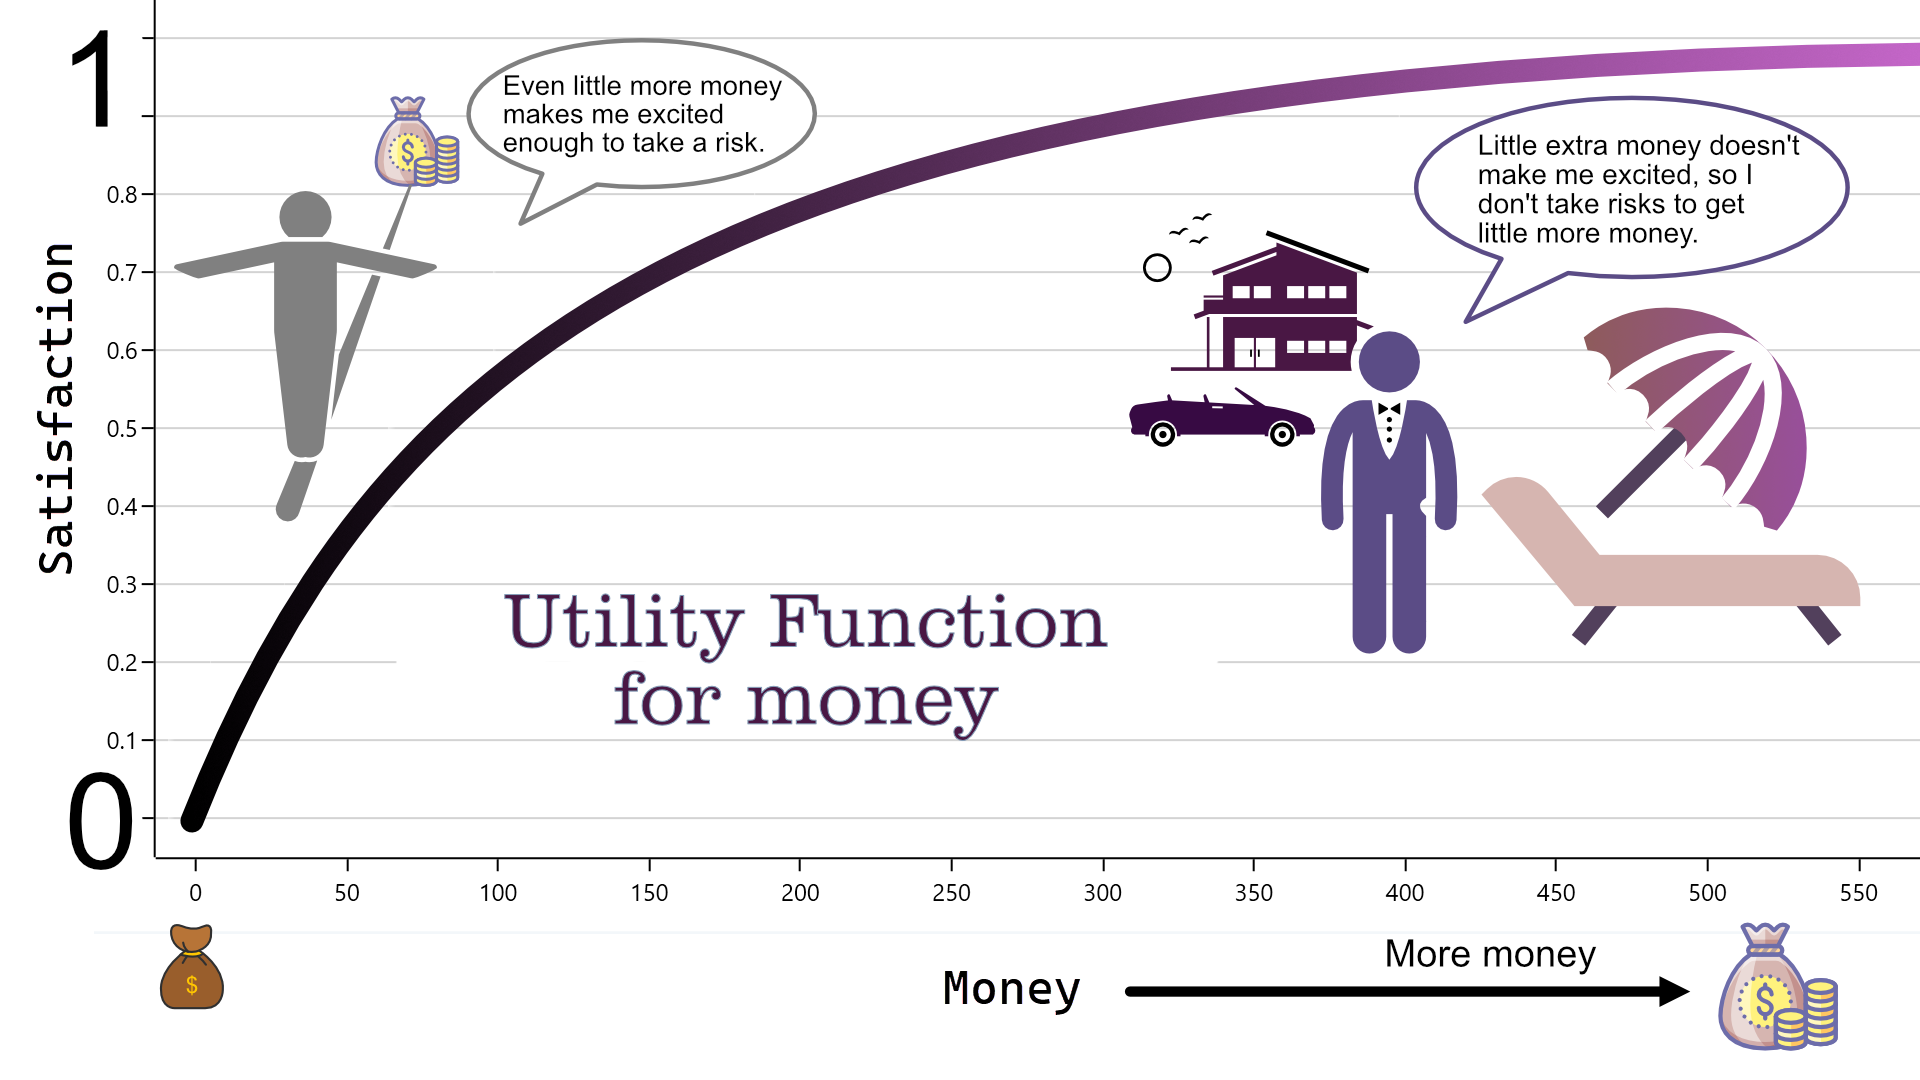
In the chart above, the X-axis is the real money you gain and the Y-axis is your satisfaction on a 0 to 1 scale. With this utility function, the person gets very excited about the first 100 dollars, but past 300 dollars each extra dollar adds almost nothing to their satisfaction. The curve flattens out.
But why? Why would anyone put a cap on how happy more money, or more of anything, can make them? There are a couple of good reasons, and they are explained below.
Why and When to Use a Utility Function?
Here are the main situations where a utility function helps.
A) When you are juggling more than one goal
Say you are buying a new phone. You want more storage and you want to pay less. Can you get a top-of-the-line phone for almost nothing? No. You cannot have both at once, so you have to make a trade-off. The smart move is to first decide how much storage is good enough for you. Once a phone clears that bar, you stop chasing extra storage and start comparing prices.
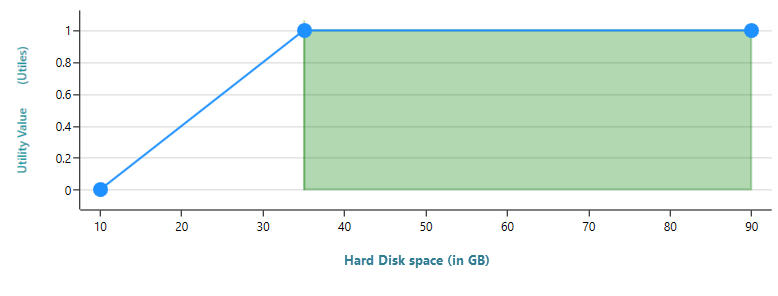
A utility function lets you build that attitude right into your decision. For example, if 35 GB is plenty for you, then a phone with more than 35 GB should not count as more attractive than another phone that also gives you at least 35 GB. Both already meet your need, so the extra storage earns no extra points. Here is the chart of a utility function that works that way.
When you build this kind of thinking into your model, your multi-criteria decision becomes far more logical and grounded in what you actually care about.
B) When your payoff comes with risk
Now imagine you are thinking about investing in a business. There is a chance it makes you a millionaire. There is also a chance you lose all of your money, or a big chunk of it. How do you judge an opportunity like that? Do you call it great just because it could pay a million dollars?
Most people like more money, but most people also hate losing money, and the two feelings are not equal. So the question to ask yourself is this: how much profit would actually be enough to make you happy with this business? Say that number is 400,000 dollars. Then, while the money is still uncertain, you should not give much extra weight to the chance of earning more than 400,000. A utility function like the one shown here captures exactly that attitude.
Once you have a utility function set up, a business no longer looks great just because its best case is huge. Suppose you are weighing two opportunities. The first could return 1 million dollars in the best case, but you risk losing 200,000. The second could return 500,000 in the best case, and you only risk losing 50,000. With the utility function above, the 500,000 opportunity comes out as the more sensible choice. Once your aspiration level of 400,000 is met, the extra upside of the first one barely moves your satisfaction, so the smaller downside of the second one wins.
This is why a more honest label for the X-axis would be real-world risky money rather than just real-world money. The numbers are payoffs you might get, not money in hand.
That is the whole point of a utility function that levels off to full satisfaction once you pass your aspiration level. It explains why you would not chase the bigger best-case payoff: that payoff is in the future and it carries risk. If the payoffs were certain, the story changes. If one option handed you a guaranteed 1 million and the other a guaranteed 500,000, you would of course take the million, and you would not need a utility function at all. But the moment you have more than one goal, as in reason (A) above, the utility function becomes useful again.
Using a Utility Function in a Real Decision
Let us walk through the phone example step by step. You have just two goals:
1. Get the most storage
2. Spend the least money
You currently have about 20 GB of data, and you figure 35 GB would be more than enough for the foreseeable future. Your budget runs from 500 dollars up to 2,000 dollars.
You have found two phones:
1. PHONE-1 has 30 GB of storage and costs 700 dollars.
2. PHONE-2 has 80 GB of storage and costs 1,500 dollars.
Which one is the better deal for you? PHONE-1, of course. There is no point paying a lot more for an 80 GB phone when you do not have nearly enough files to fill that space.
The chart below shows a utility function for storage that matches this thinking.
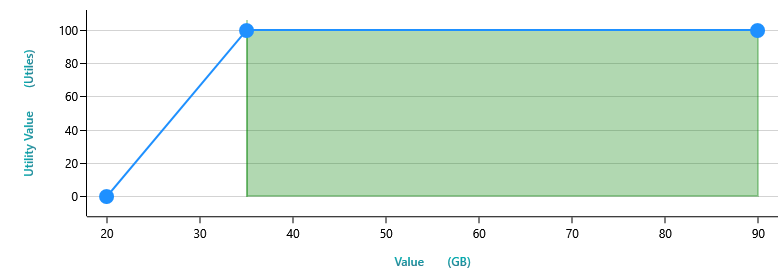
The chart tells the story clearly. Your satisfaction at 20 GB is 0. You already have 20 GB of files, and a phone that can only just hold what you have is no good to you, since your content will keep growing and you will need room to spare. We also decided that 35 GB is just enough, so anything past 35 GB adds no extra value. That is why the line stays flat above 35 GB: more storage, same satisfaction.
The Utility Function feature in the Decision Tree software
The SpiceLogic Decision Tree Software & Analyzer lets you build your own custom utility function quickly and visually.
What happens if you skip the utility function
Suppose you create a Number type criterion called "Maximize disk space" but you do not attach a utility function to it. In that case the software assumes utility rises in a straight line with disk space: twice the space means twice the satisfaction. It looks like this.
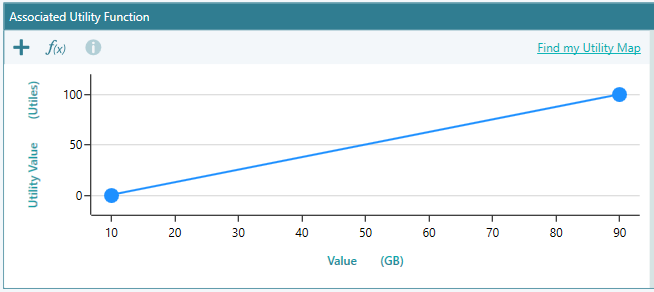
This is the straight-line utility function the software uses behind the scenes when you do not define one yourself.
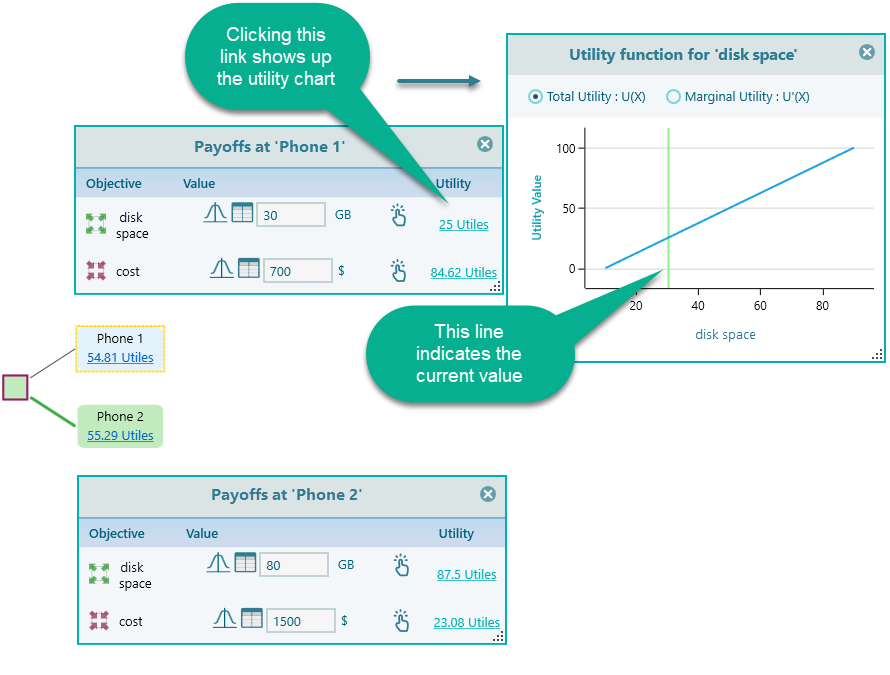
With that default in place, once you enter the facts about the two phones into your decision tree, the utility values come out as shown below. The screenshots that follow simply use the decision tree as an example to make the point.
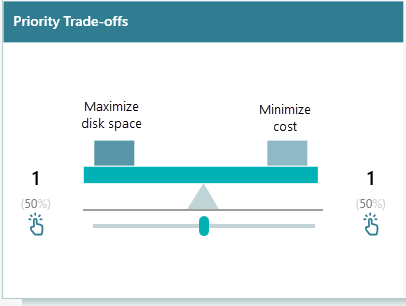
Say you care equally about both criteria, disk space and cost. In that case you can leave the pairwise comparison setting as it is, shown below on the criteria page.
Without a satisficing utility function in place, your result may look like this.
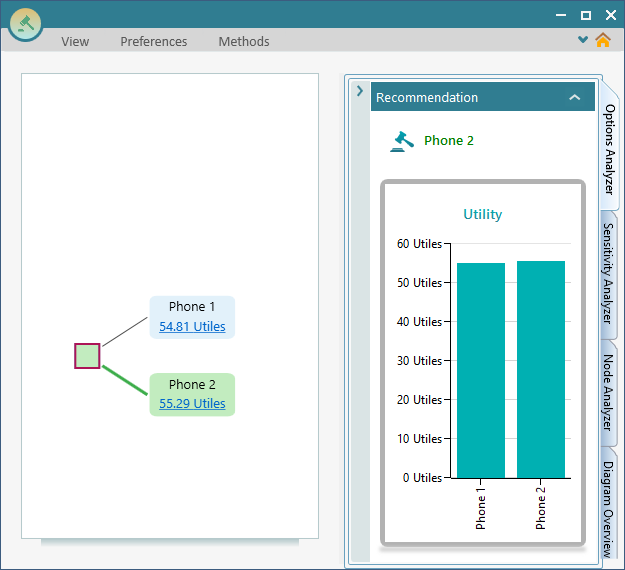
Notice that even though Phone 2 is recommended here, the total utility of Phone 1 and Phone 2 is almost the same. You can see it in the chart: the two bars are nearly the same height. That leaves you stuck, with no clear sense of which phone is really right for you.
This is where the utility function helps. Once you add a utility function and let the result be calculated from it, you get a much clearer picture of the two options and an easy decision.
How the decision improves with a utility function
A utility function can be attached to a Number type criterion. It does not apply to the other types of objectives. If you have a number-type objective, you can double-click its name in the Payoff popup, or right-click to open the context menu and choose the Edit item.
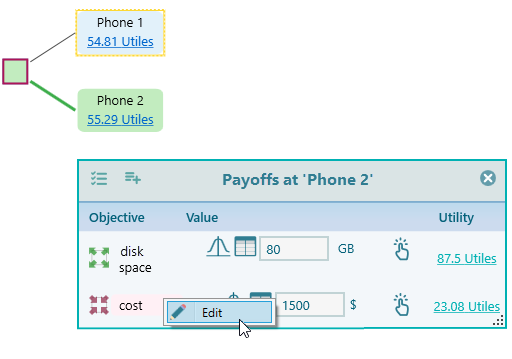
You can also go to the Criteria page, select the criterion there, and either double-click it or open the criterion editor from the context menu.
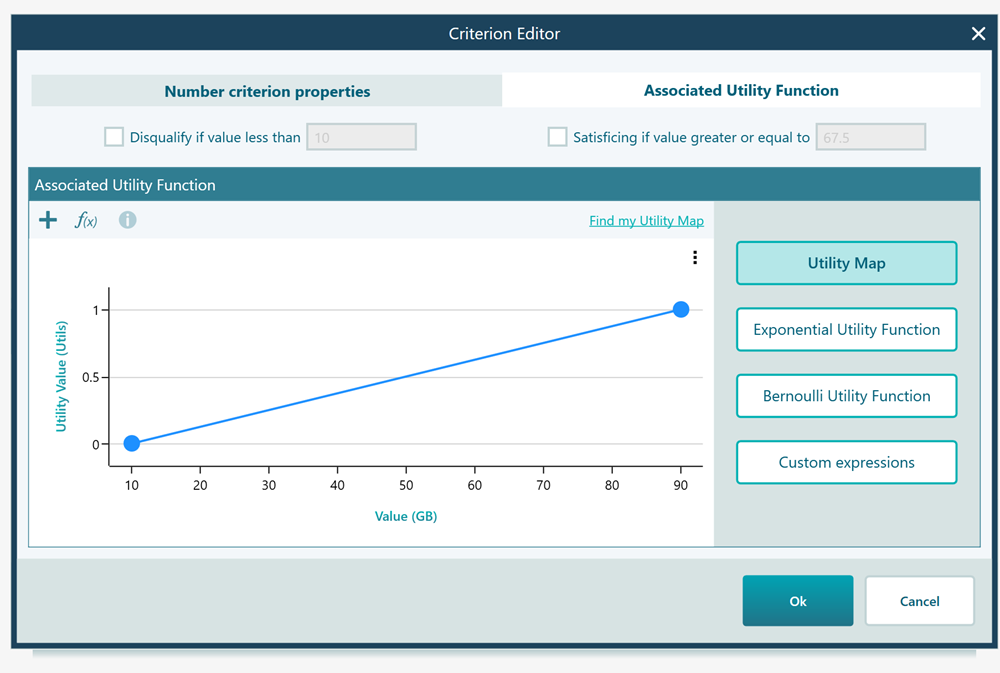
When you open the criterion editor for Disk space, you will see the following screen.
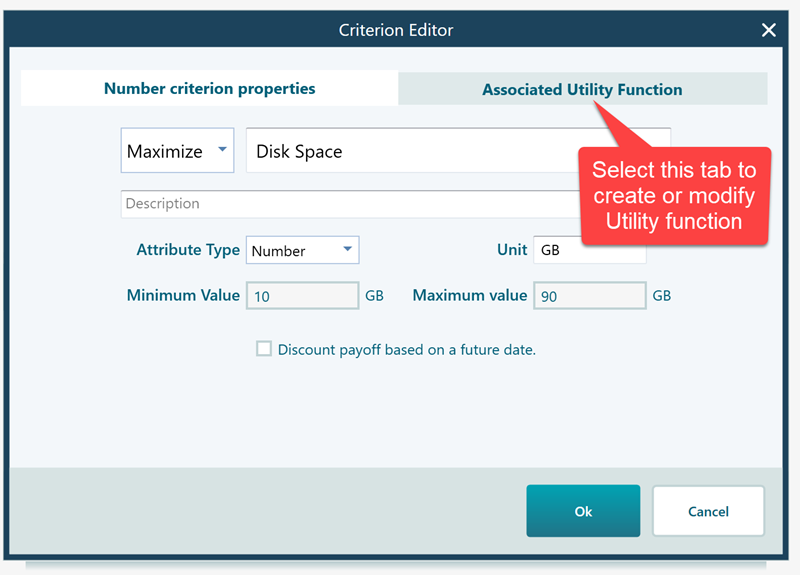
Click the "Associated Utility Function" tab and the utility function editor opens.
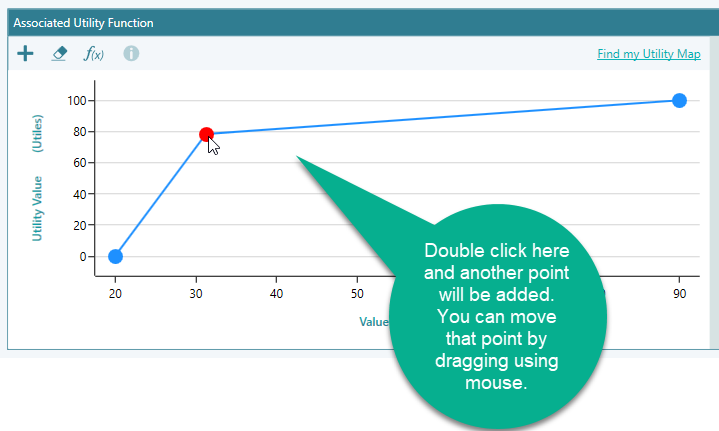
Double-click anywhere on the panel to add a utility point at that spot. Then just hold and drag the point with your mouse to shape the curve the way you want. Add as many points as you need, and keep dragging until the curve matches how you really feel about each value.
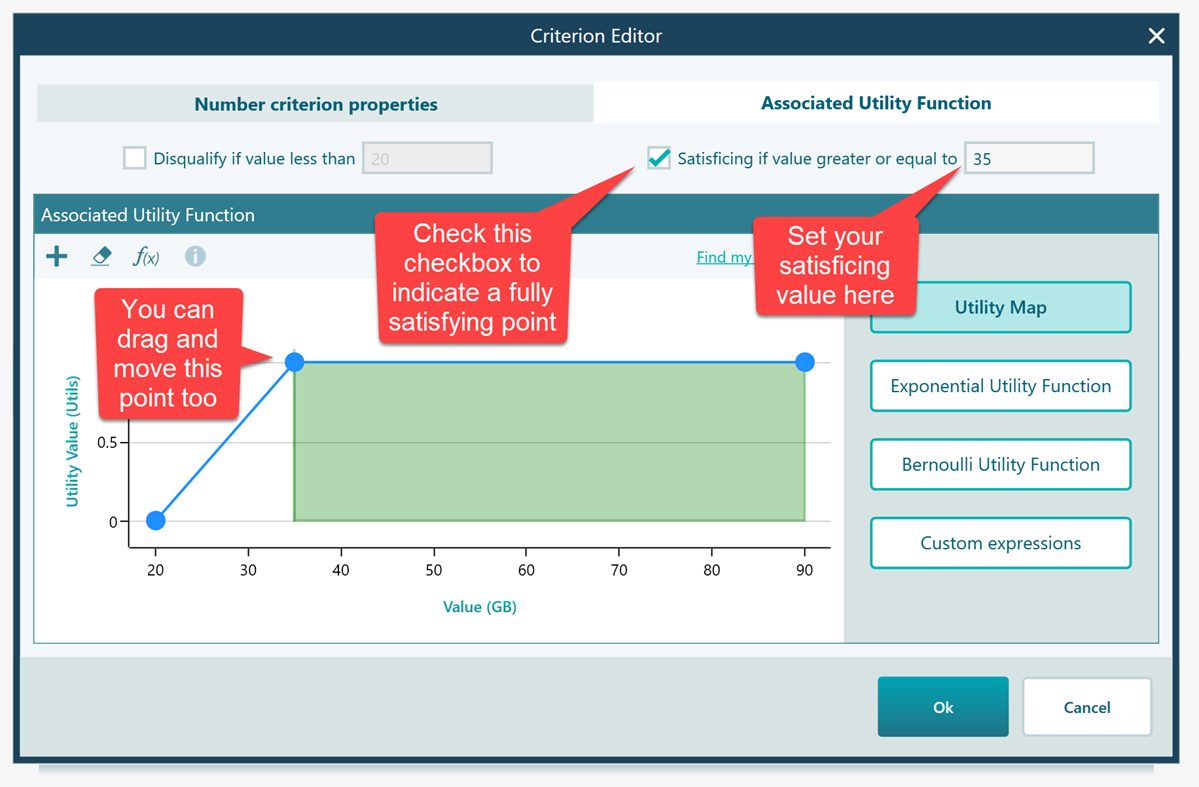
An easy way to add a satisficing boundary is to tick this checkbox, shown in the screenshot. It flattens the curve once you reach your "good enough" point, so values past that point stop adding satisfaction.
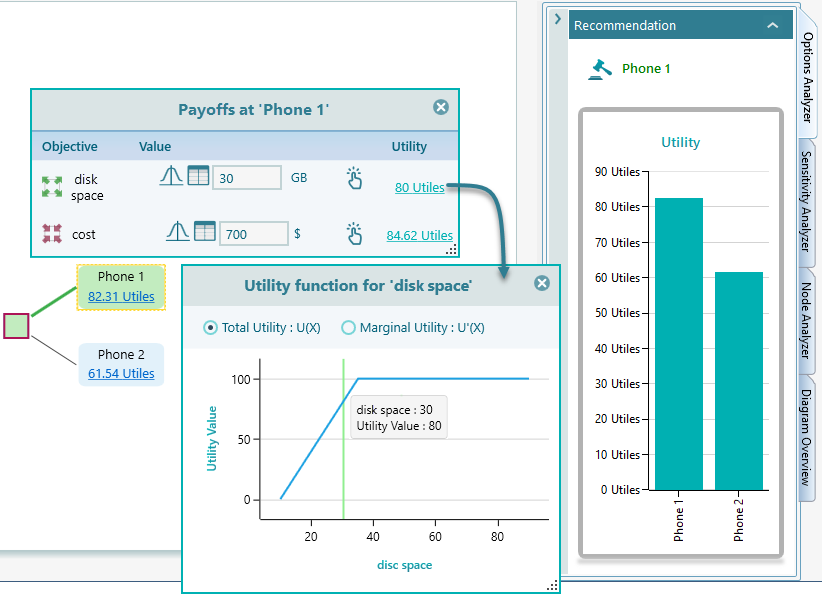
Once you click OK in the editor, you will see that the overall value for Phone 1 and Phone 2 is now clearly different, and it is easy to see that Phone 1 is the right choice. Here is why. Both phones satisfy your storage need to about the same degree, so neither one really pulls ahead on disk space. That makes price the deciding factor, and since Phone 1 costs less than Phone 2, Phone 1 wins.
So once again the lesson is the same: instead of maximizing real-world values, you should maximize utility value.
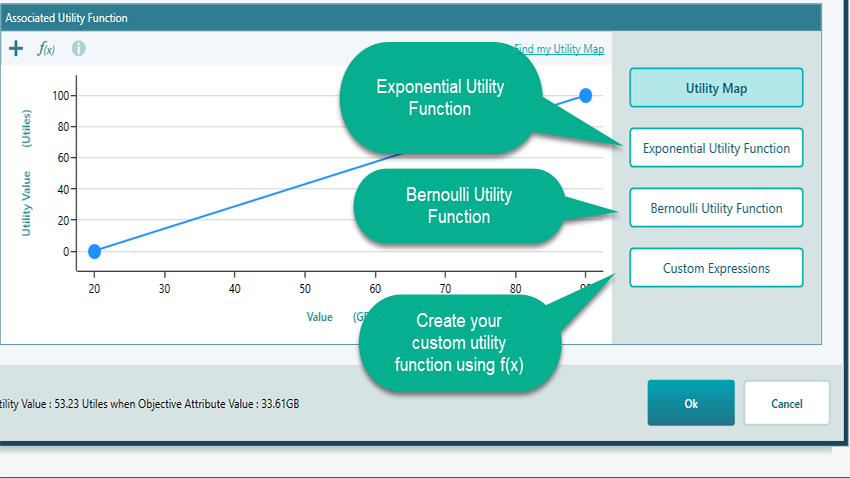
There are several other ways to model a utility function. You can use the "Exponential Utility Function" or the "Bernoulli Utility Function". And if you would rather write the function as a direct equation, such as f(x) = e^x, you can use the "Custom Expressions" tool.
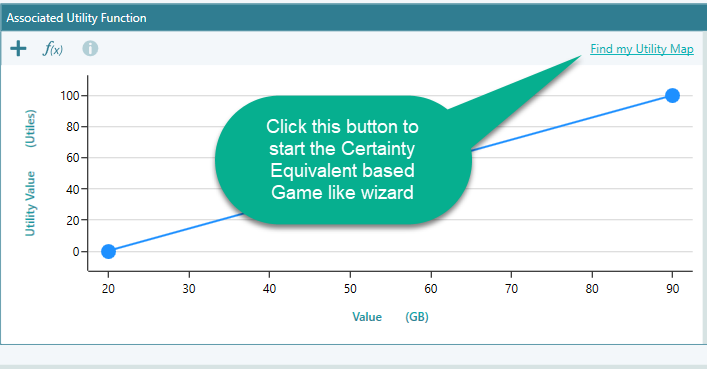
Not sure what your utility function should look like? Decision Tree Software & Analyzer includes a game-like wizard that figures it out for you. It walks you through a simple lottery setup, asks for your certainty equivalent at each step, and then works out your utility function from your answers. Click this button to start the wizard.
You can also view the utility function equation alongside the equations for the Marginal Utility Function, Absolute Risk Aversion, and Relative Risk Aversion. Just click the f(x) button shown below.
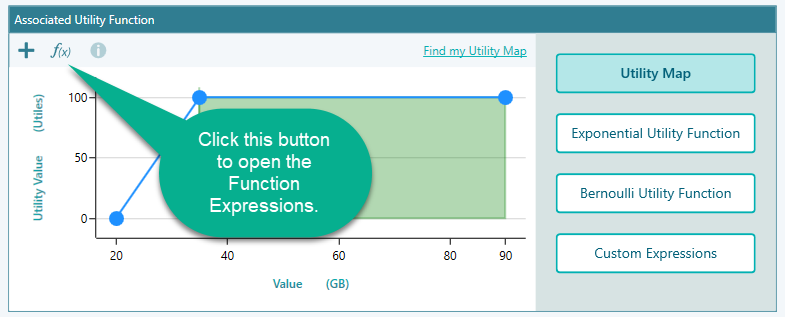
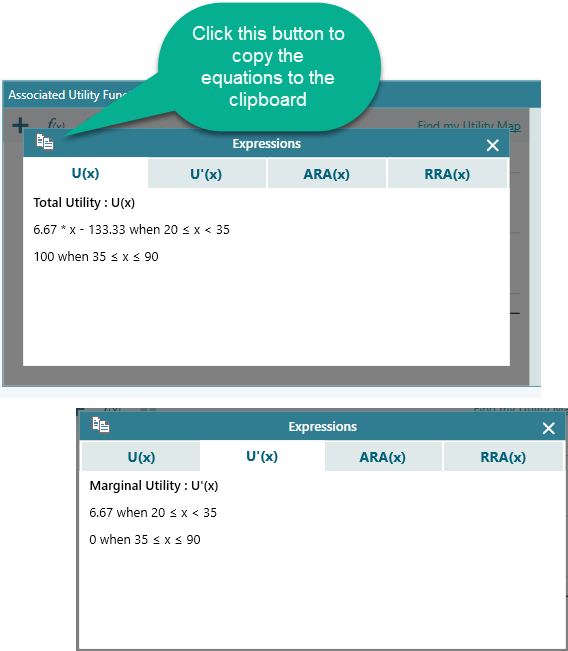
When you click the f(x) button, a popup appears like this.
Risk aversion from the utility function
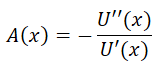
Risk aversion is a measure, based on real-world payoff, of how cautious a person is about risk. A risk-averse person would rather take a sure smaller payoff than gamble on a bigger one. Once you have defined a utility function U(x), the software can work out the risk aversion measures straight from it.
The absolute risk aversion is:
and the relative risk aversion is:
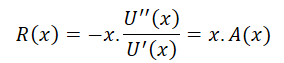
The Decision Tree software shows both the absolute risk aversion function and the relative risk aversion function right inside the utility function editor, so you can see them next to your curve.
Conclusion
The big takeaway is simple: more does not always mean better. There is usually a point where you have enough, your satisficing value, and past that point extra amounts add little. So when you make a decision, do not fall into the "more is always better" trap. Define your utility function first, then judge your options against it. You will be surprised how much sharper your choices become once utility functions are part of your decision-making process.
