


Numerical criterion
What is a numerical criterion?
Sometimes the thing you care about is just a number. You want more of it, or less of it. Salary, profit, cost, travel time, distance, weight, response time, fuel use. These are all numbers you can measure and compare. In this software, a goal like that is called a numerical criterion. You either want to maximize it (more is better, like salary) or minimize it (less is better, like cost).
A raw number on its own does not tell the software how happy you are with it. Going from $40,000 to $50,000 a year feels like a big jump. Going from $200,000 to $210,000 is the same $10,000, but it probably matters far less to you. To handle this, the software maps each real number to a level of satisfaction. That mapping is done with a utility function, which turns the actual value into a satisfaction score between 0 and 100 (or 0 to 1, whichever you prefer). The number is the fact. The utility is how good that fact feels to you.
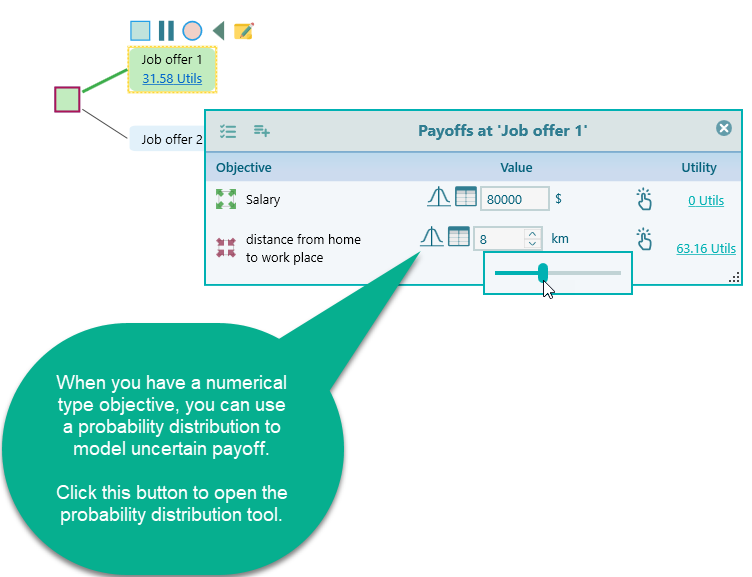
The payoff entry box for a numerical criterion
After you create a numerical criterion, it shows up when you set a payoff on a decision tree node. You get a simple number input box. Click into that box and a slider appears, so you can drag to a value instead of typing it. The slider is just there to make entry faster, which helps a lot when you are filling in many nodes.
Here is a quick example. Say you are weighing a new job and you care about two things:
- Maximize salary.
- Minimize the distance from home to the workplace.
Once you set those two goals up, the decision tree payoff window gives you an input for each one, and it looks like this.
Modeling a probability distribution
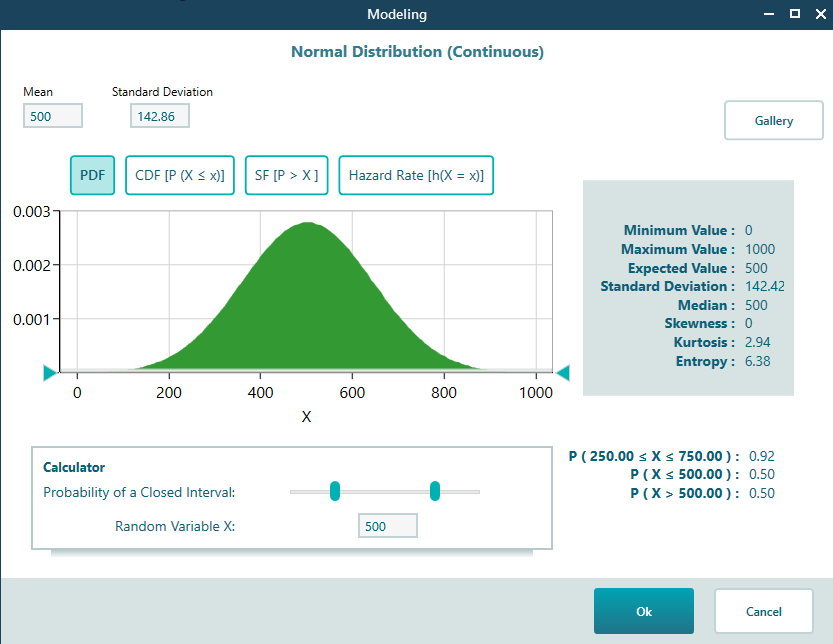
A payoff is not always a single fixed number. Often you are not sure exactly what you will get. The salary might land somewhere between $80,000 and $95,000. The repair bill could be anywhere from $500 to $2,000. Instead of forcing yourself to pick one guess, you can describe the whole range and how likely each part of it is. That is what a probability distribution lets you do.
For example, you might think a repair is most likely to cost around $1,000, but it could be a bit less or a lot more. A distribution captures that shape, so the result reflects the real spread of what might happen instead of one optimistic guess.
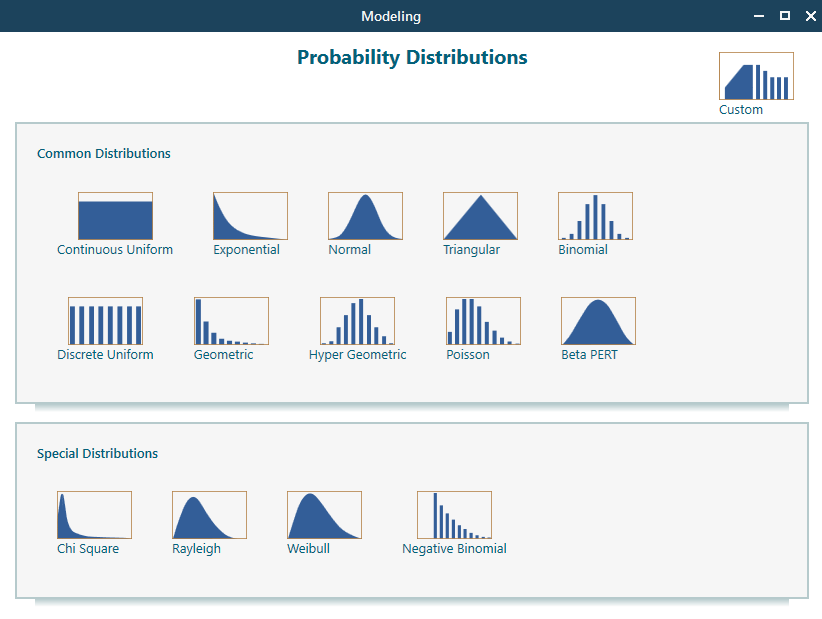
Click the probability distribution button next to the payoff and the probability distribution tool opens. That tool is covered in detail on its own page, so check there for the full walkthrough of choosing and shaping a distribution.
Once you have picked and set up a probability distribution for a numerical criterion, the payoff window shows an icon to remind you that this value is a distribution and not a single fixed number. That way you can tell at a glance which payoffs are a range and which are a plain number. You can see that icon below.
When you have more than one goal, the probability icon appears in the popup window for each numerical criterion, so you can see which ones use a distribution. This is shown below.
Entering a payoff as a table
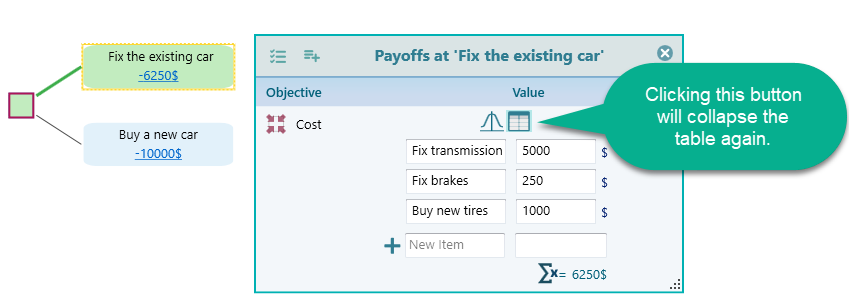
Sometimes a single payoff is really a list of smaller amounts added together. Picture this. You are deciding whether to buy a new car or fix the old one, and the old car has a few problems. The repair cost is not one number. It is the brake job, plus new tires, plus the transmission work, plus a couple of small things. You want to add all of that up to get the true payoff.
You do not need to open Excel for this. In the payoff window, click the table icon to open the table entry, type in each line item, and the software adds them up for you and uses the total as the payoff. If you change one line later, the total updates on its own.
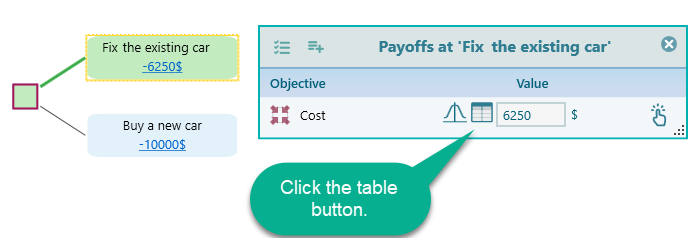
After you click the table entry button, the table entry screen opens. You can see it below. Add a row for each item, enter its amount, and the running total becomes your payoff. So for the car repair, you would add one row for the brakes, one for the tires, one for the transmission, and so on, and the total at the bottom is what gets used.
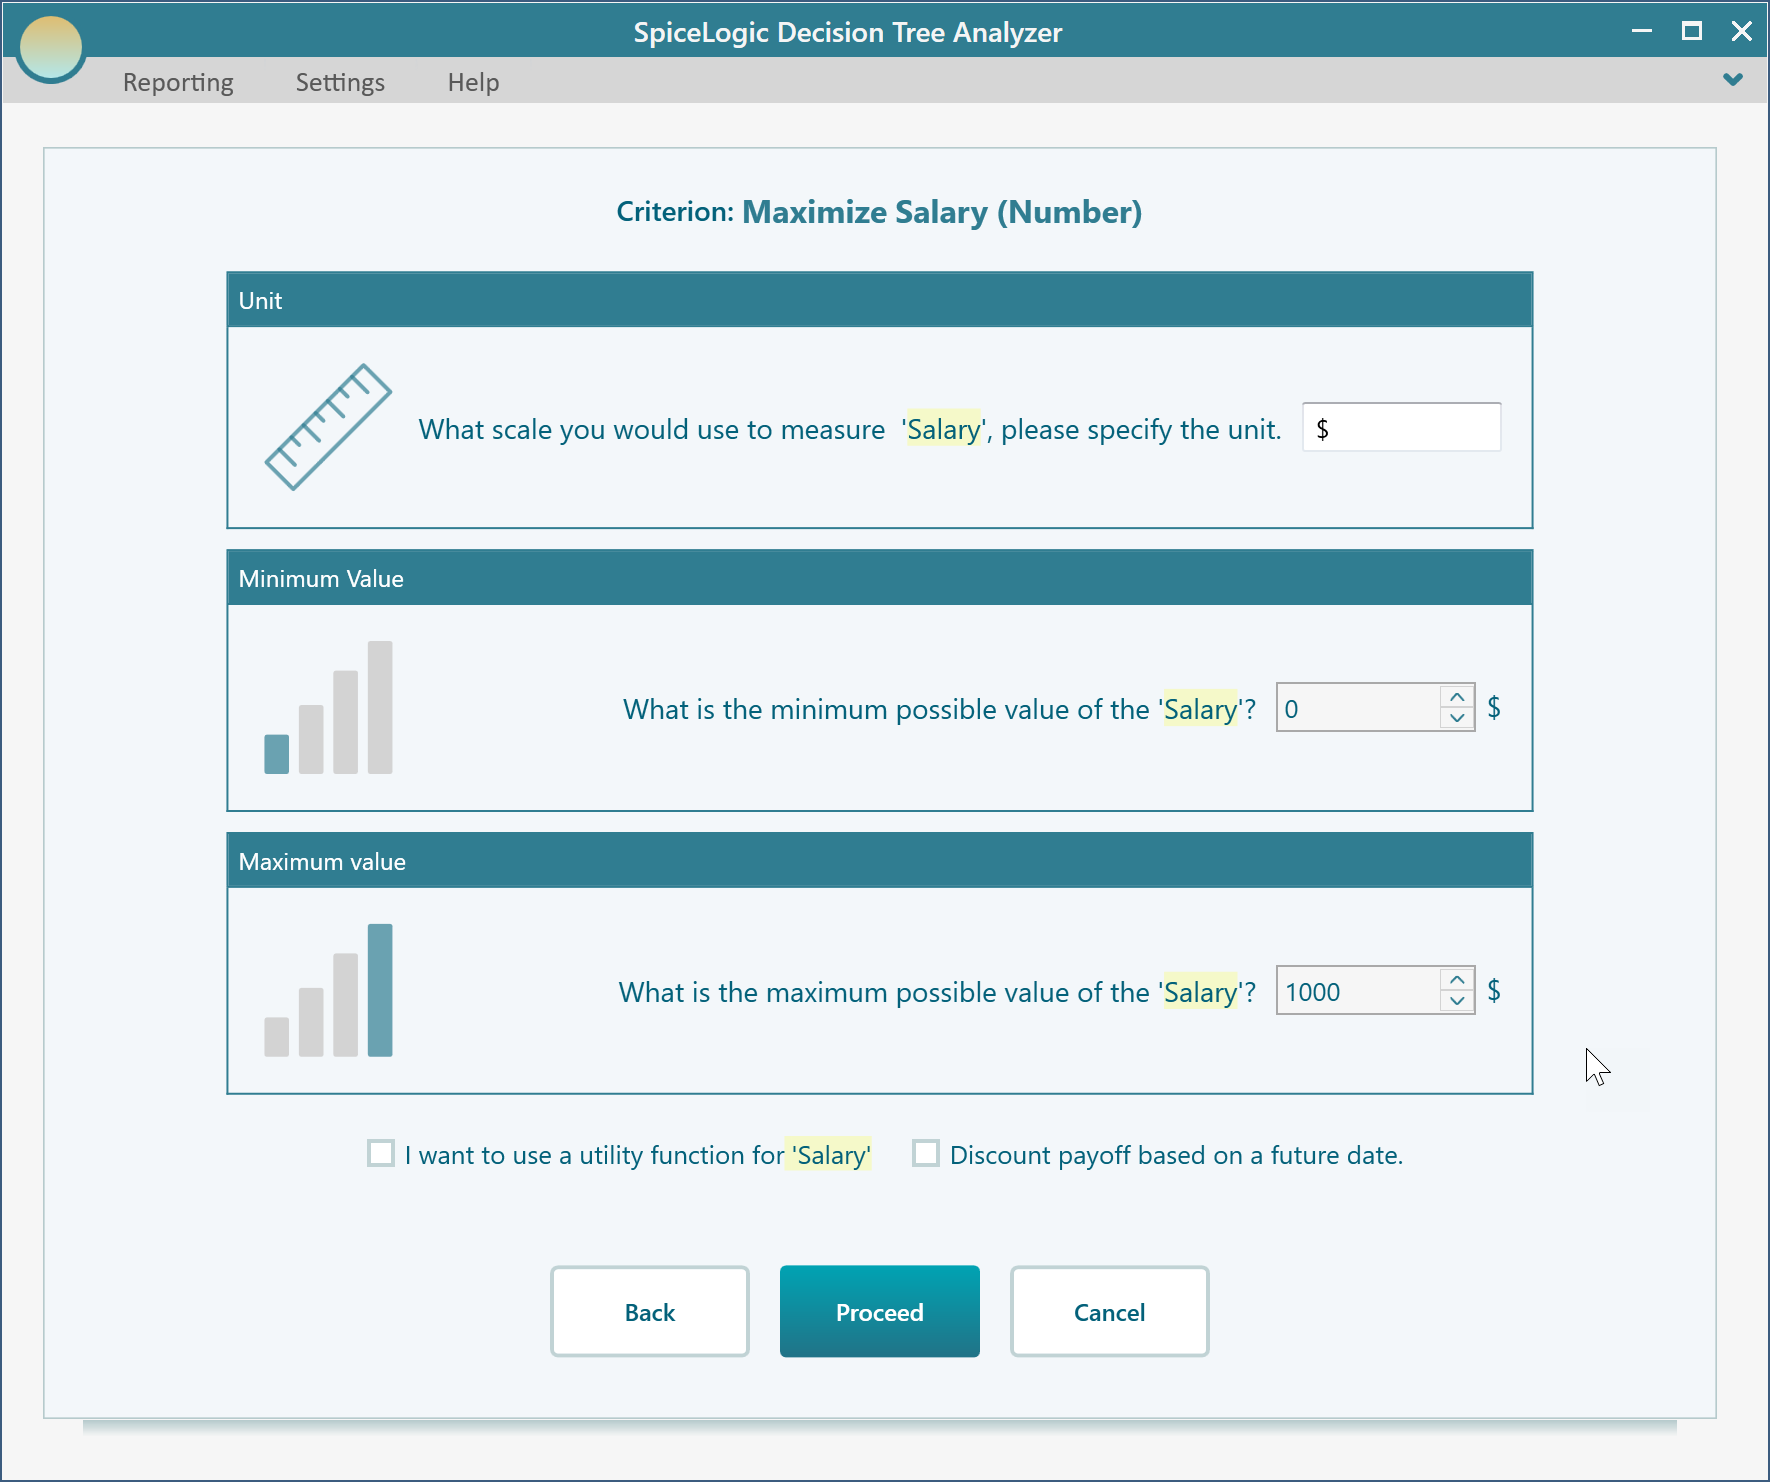
How to create a numerical criterion
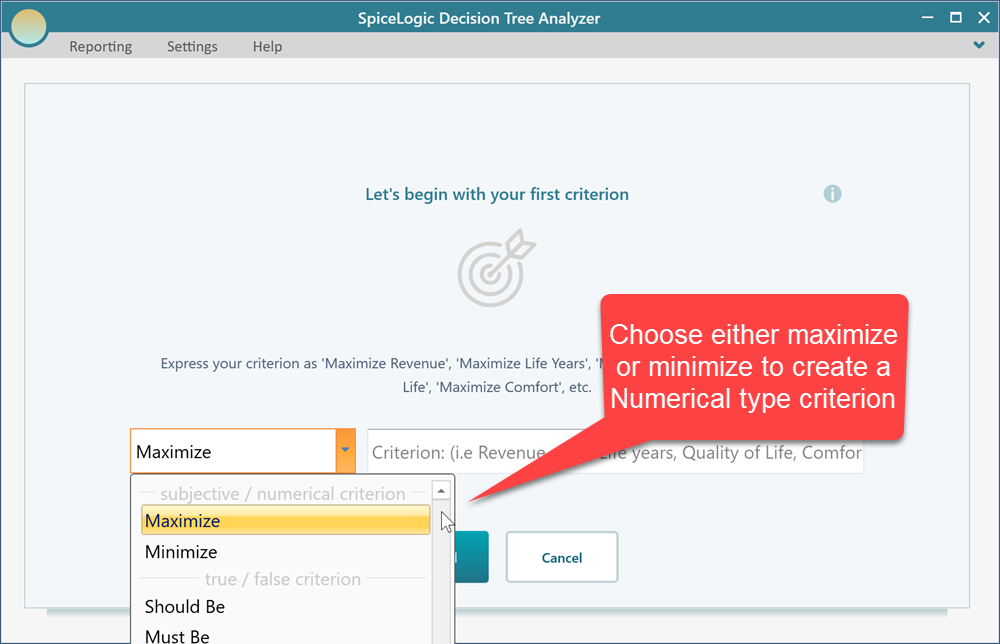
When you start the criteria creation wizard, you see the screen below. To make a numerical criterion, just pick either Maximize or Minimize from the drop-down. Choose Maximize when more is better, like salary or profit. Choose Minimize when less is better, like cost or travel time.
As an example, say you have typed in the criterion below on the objective start screen.
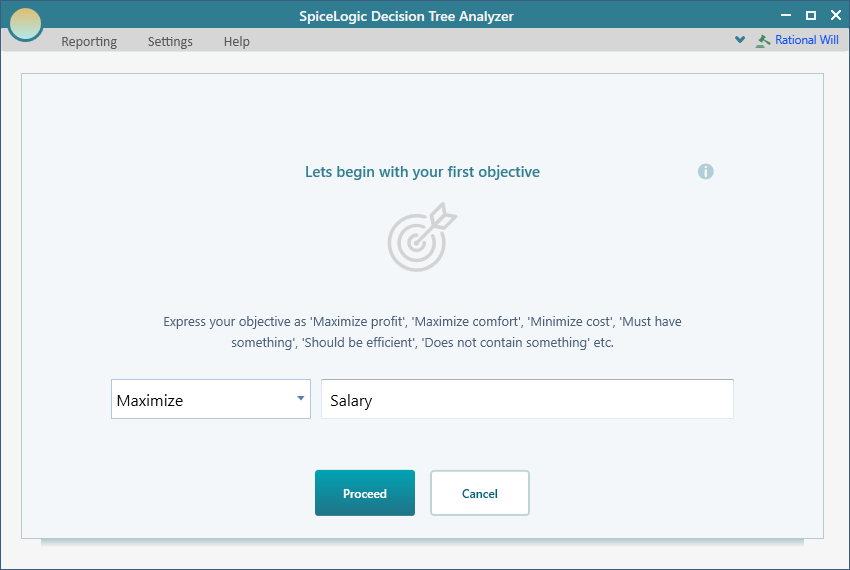
When you click the 'Proceed' button, the next screen asks you a question, as shown below.
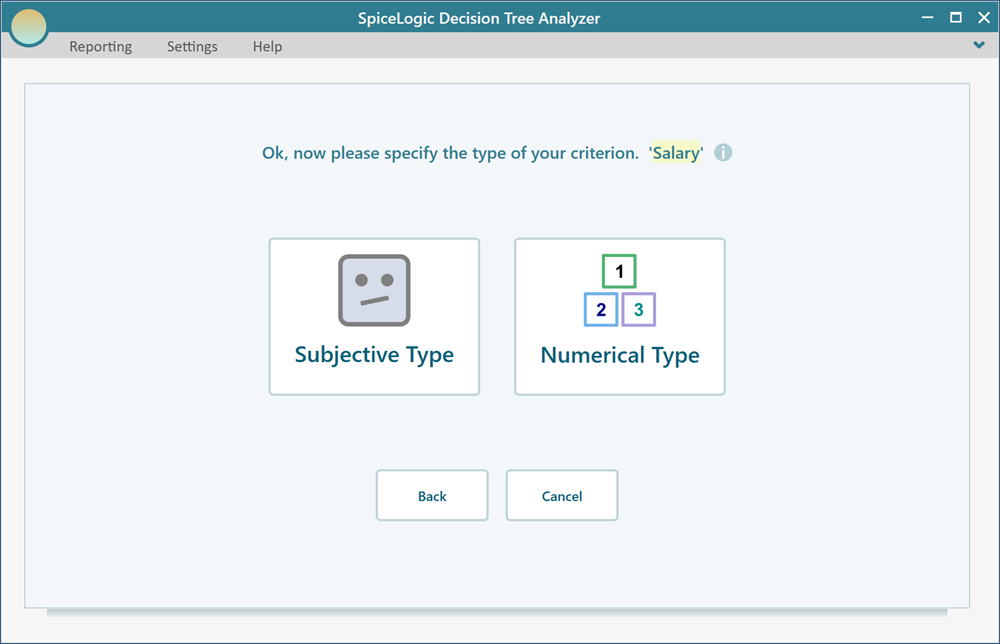
On that screen, click the Numerical Type button. The software then asks you for a few things: a unit (this one is optional, for example dollars, km, or hours), the smallest value the criterion could realistically take, and the largest value it could realistically take.
Why does it ask for a minimum and a maximum? Two reasons. First, the utility function needs a range to work with, so it knows what counts as the worst case and the best case when it scores your satisfaction. Second, the payoff window uses that range to draw the slider, so when you set a value later you can just drag between your minimum and maximum instead of typing. For a salary criterion you might set the minimum to $40,000 and the maximum to $120,000, and the slider then covers that band.
Editing a numerical criterion
We have already covered how to open the criterion editor. Once you have created a numerical criterion and open its editor, you see the view below. This is where you adjust the details after the fact, so nothing you set in the wizard is locked in. If you guessed your salary range wrong at the start, you can come back here and fix it.
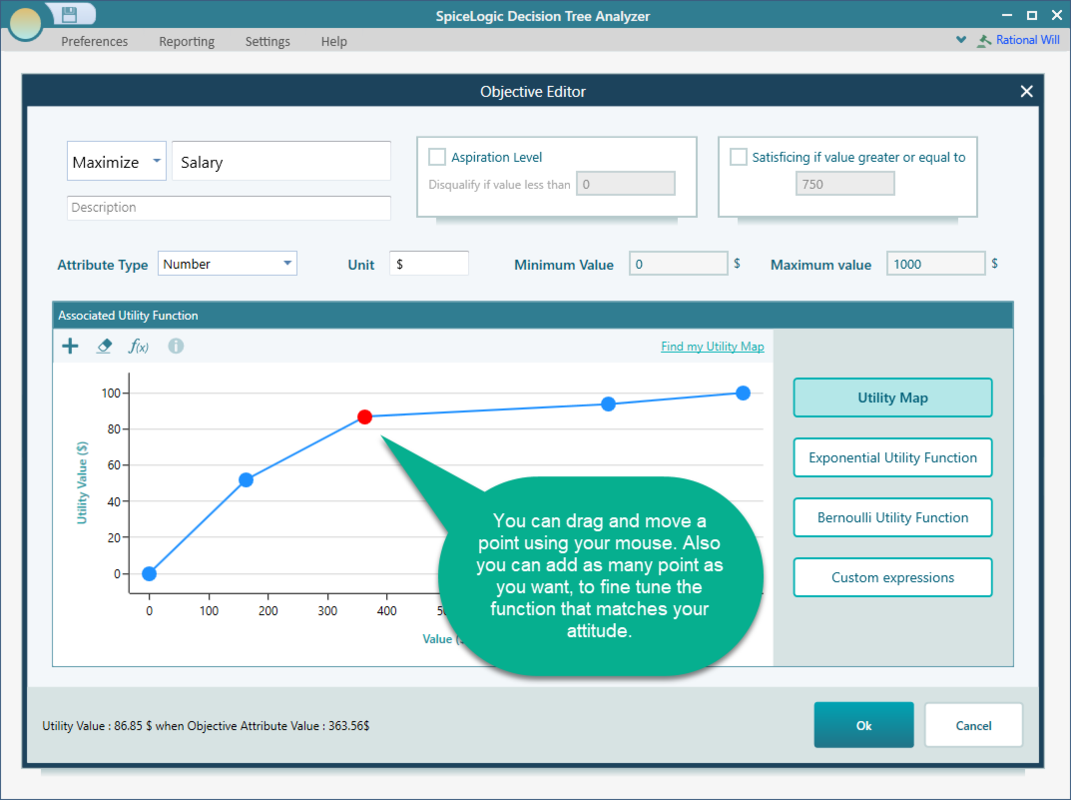
From here you can change the minimum value, the maximum value, the unit, and the attribute type. You can also switch the goal between Maximize and Minimize, and rename the objective. You will also notice a few extra settings that were not in the wizard: aspiration level, satisficing, and an associated utility function. Here is what each one means.
Aspiration level
The aspiration level is your line in the sand. It is the payoff value below which you no longer count the result as a real success. When your goal is to maximize something, any payoff under the aspiration level is treated as disqualified or rejected. When your goal is to minimize something, like cost, it flips: any value above the aspiration level is treated as disqualified.
Why does this matter in a decision tree? Several risk measures need a threshold to decide what counts as a failure, and the aspiration level is that threshold. For example, Baumol's risk measure and Roy's safety first rule both rely on it. Set the aspiration level and these metrics know where the bar is. Say you are looking at a job and any salary under $50,000 just will not work for you. You set $50,000 as the aspiration level, and any outcome below that is marked as a failure for the risk math.
Satisficing
The satisficing value is the opposite end. It is the payoff that is good enough. When your goal is to maximize something, any payoff at or above the satisficing value counts as fully satisfactory. Once a payoff hits that mark, you do not need to keep chasing a higher number on that one criterion just because another option scores a little better there. For example, if any salary at or above $90,000 is genuinely good enough for you, set that as the satisficing value and the software will stop rewarding salaries beyond it as if they kept getting better.
Utility function
In the numerical criterion editor you also get a panel for building a utility function. A utility function can be attached to any number or money objective, and it is what turns a raw value into a satisfaction score. There is a dedicated page for the utility function that walks through how to shape one for your numerical criterion in detail.