


Getting Started
A decision analytics platform for healthcare technology assessment and high-stakes modeling. About Decision Tree Software →
Getting Started with Decision Tree Software
Welcome to the world of decision analysis. SpiceLogic Decision Tree Pro is a decision tree maker and analyzer for modeling choices, uncertainty, payoffs, risk, utility functions, cost-effectiveness analysis, Markov models, Monte Carlo simulation, and more.
This getting-started page does not try to explain every feature. The other documentation pages cover those details. Here, we will build a simple decision tree with payoffs and run an expected-value analysis. That is one of the most common and useful ways to start using the software.
The example is medical, but the software is not limited to healthcare. The same decision-analysis ideas apply to business, engineering, finance, operations, and many other fields. Healthcare students often use this software, so a medical example is a helpful way to demonstrate the workflow.
Suppose you are modeling a medical decision with two first options: "Do a test" and "No test". If you do the test, the result can be positive or negative. In either case, you then choose between "Treatment A" and "Treatment B". Each treatment can succeed or fail, and each outcome has a life-year payoff for the patient.
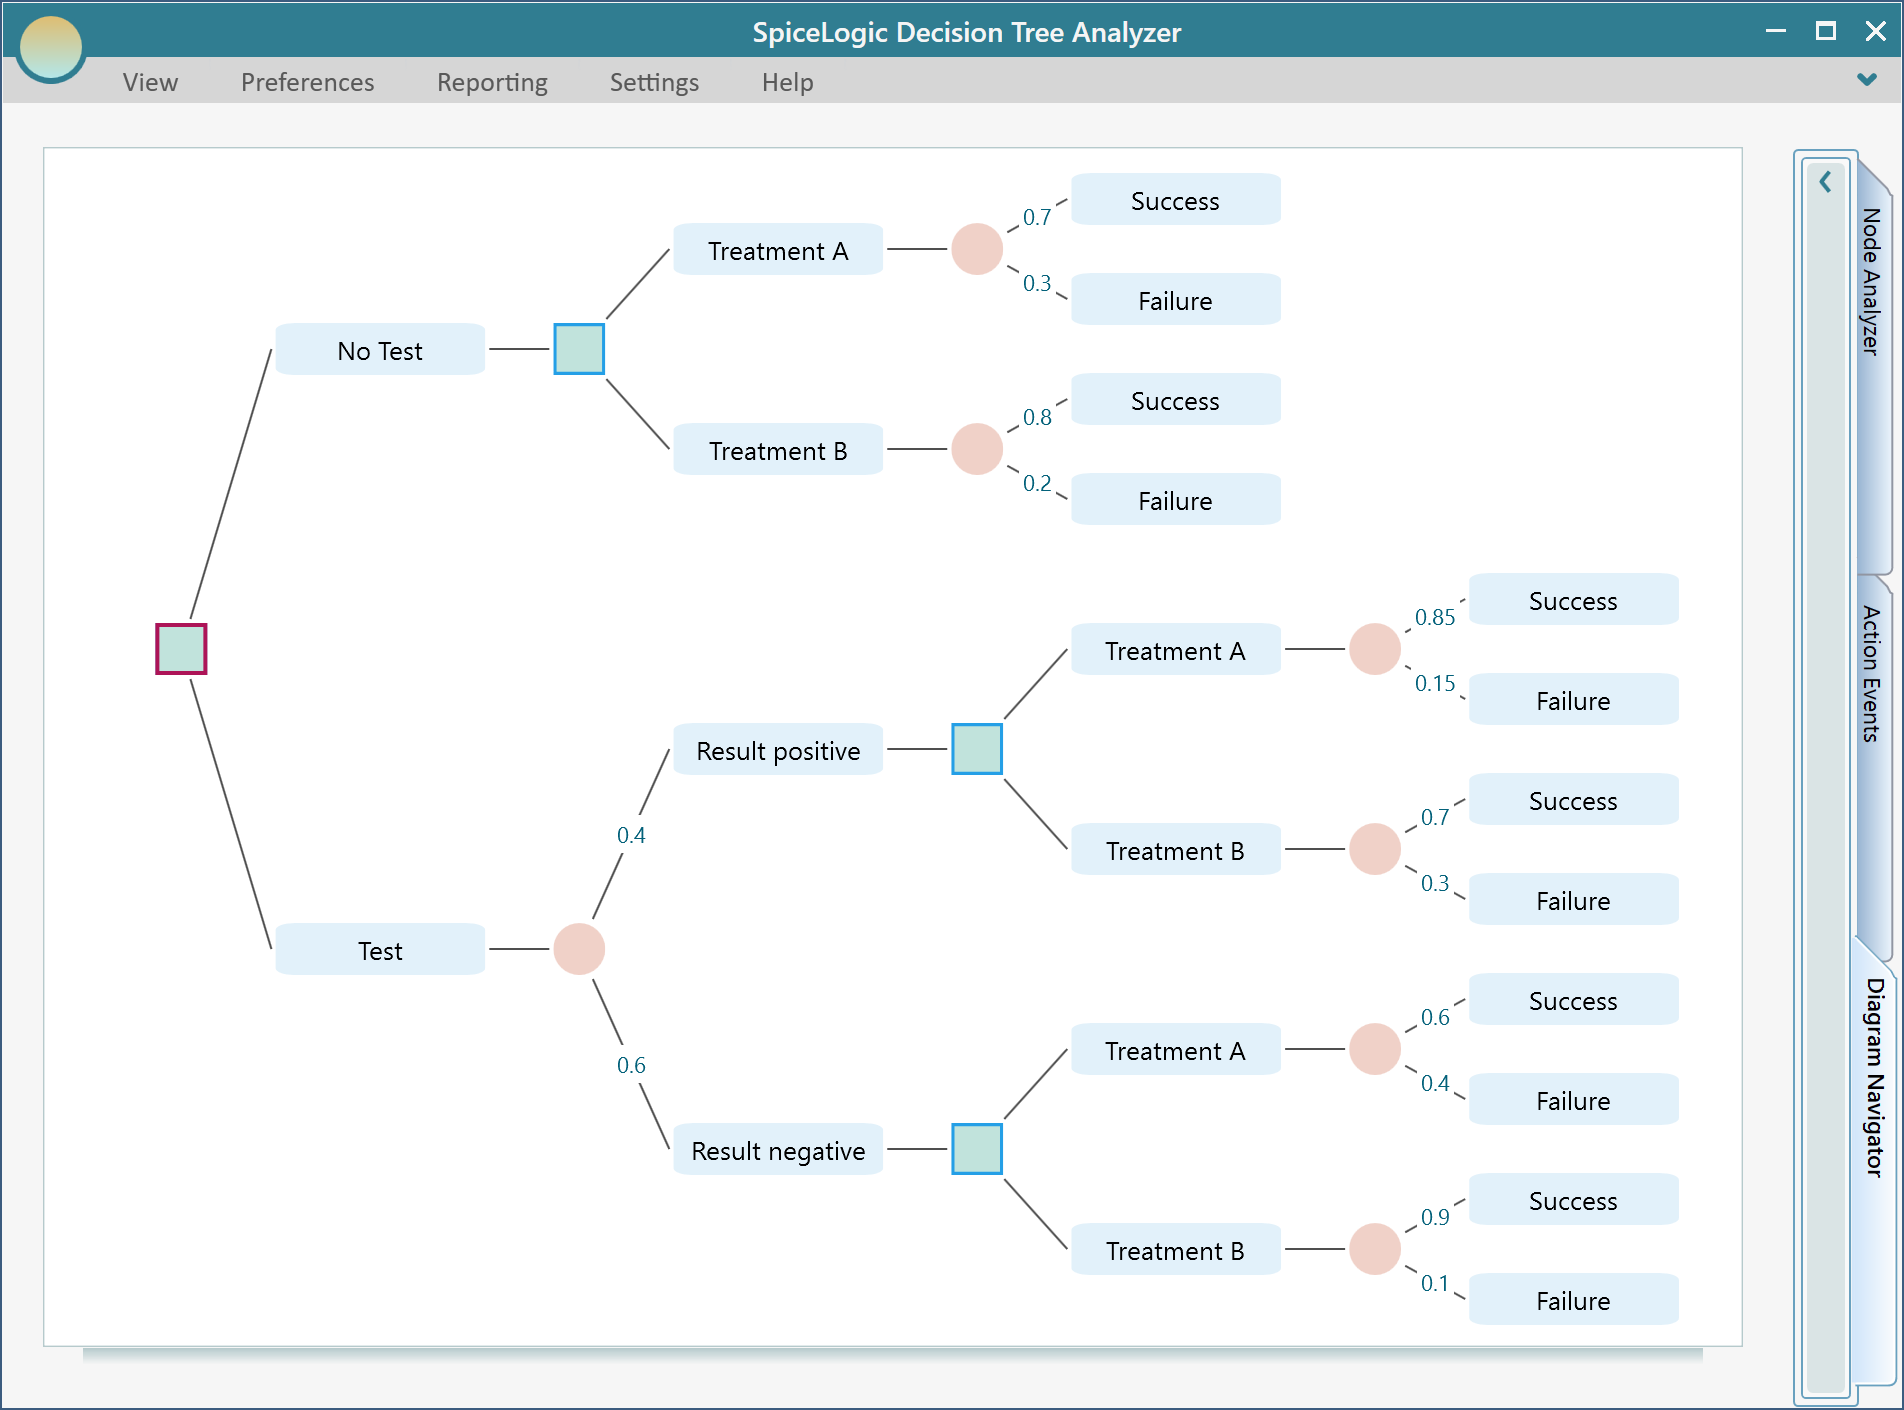
Using a decision tree, we want to calculate the expected value and identify which option gives the better result. The final model we are going to build is shown below.
One more note: Rational Will includes the Decision Tree module. If you came here from Rational Will, this documentation still applies. The standalone Decision Tree software and the Decision Tree module inside Rational Will use the same workflow.
Start SpiceLogic Decision Tree Pro. You will see the start window below. You will also see this same window if you click "Decision Tree" from the Rational Will start screen.
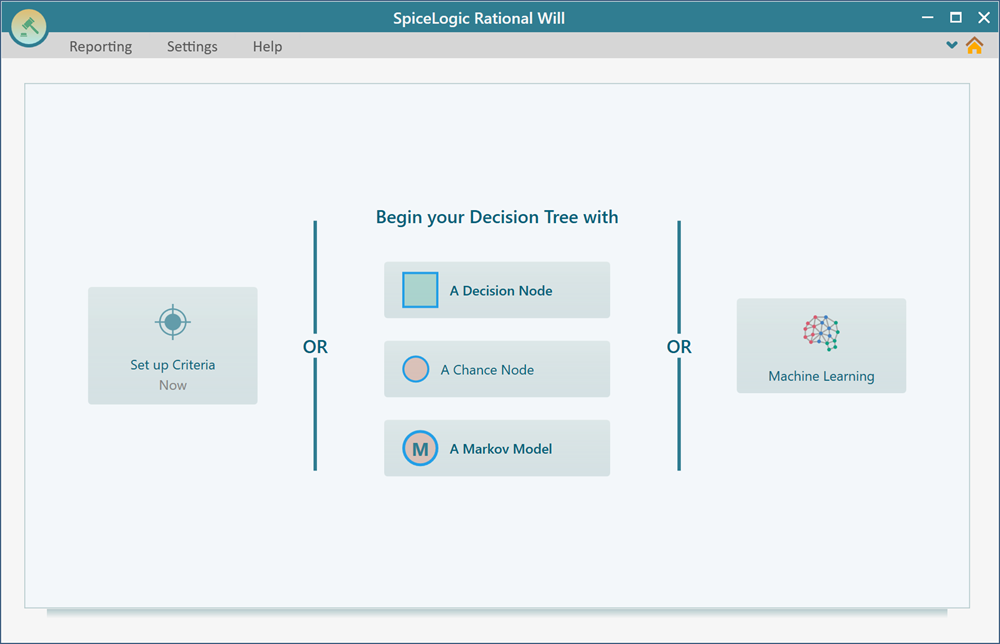
In the center, you will see "Begin your Decision Tree with" and several buttons: "A Decision Node", "A Chance Node", and "A Markov Chance Node". These buttons choose the root node of your tree.
In most regular decision models, the root node is a Decision Node. Use a Chance Node when you want to start with uncertainty or perform probability analysis. Use a Markov Chance Node when you are building a Markov chain or Markov decision process, which is covered on a separate page.
For this tutorial, click "A Decision Node".
Creating a Decision Node and Actions
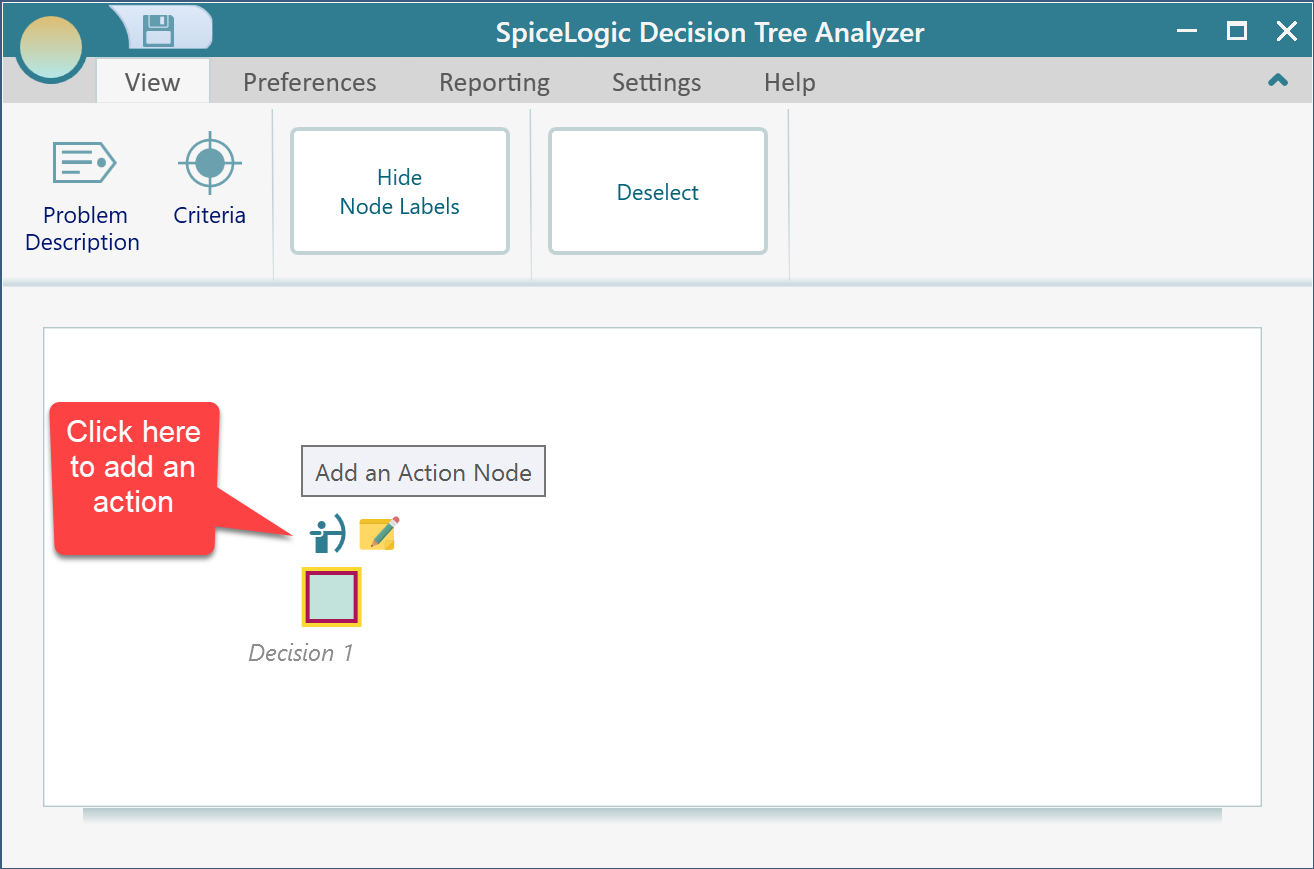
After the decision node is created, notice the fly-over menu. When you select a node, the software shows a small menu with the child node types that are valid for that node. This keeps the controls close to the diagram.
Click the fly-over menu button for creating an action node. Click it twice to create two actions.
Now edit the action text. Double-click an action node to turn it into an editable text box.
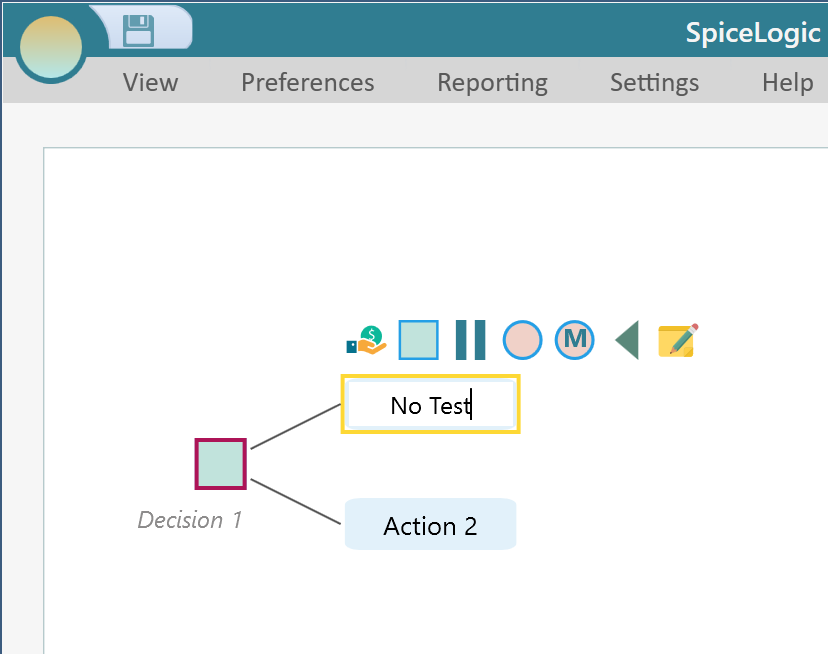
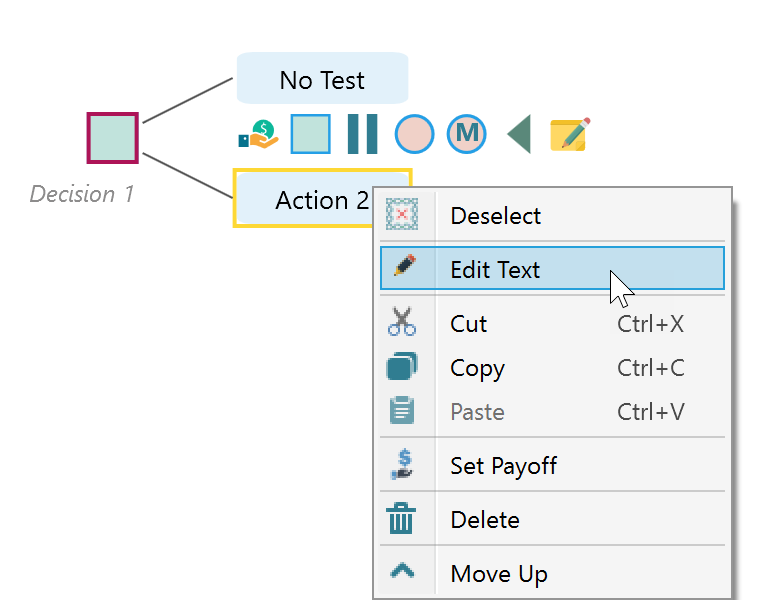
You can also right-click a node to open its context menu. The context menu includes commands such as Edit and Delete.
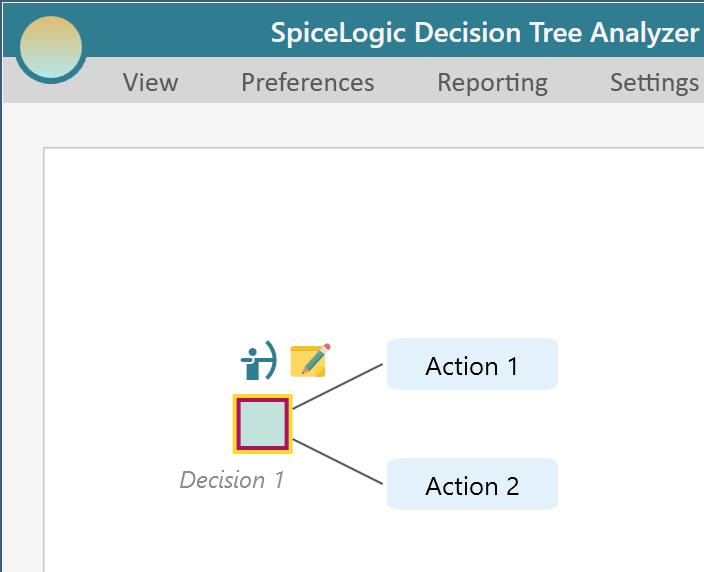
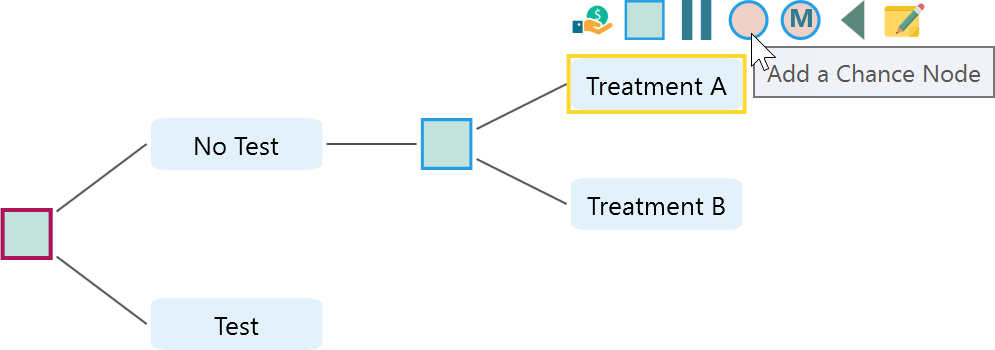
After you rename the two actions as "No Test" and "Test", select the "No Test" action node. From its fly-over menu, click the square symbol to add a decision node as a child of that action.
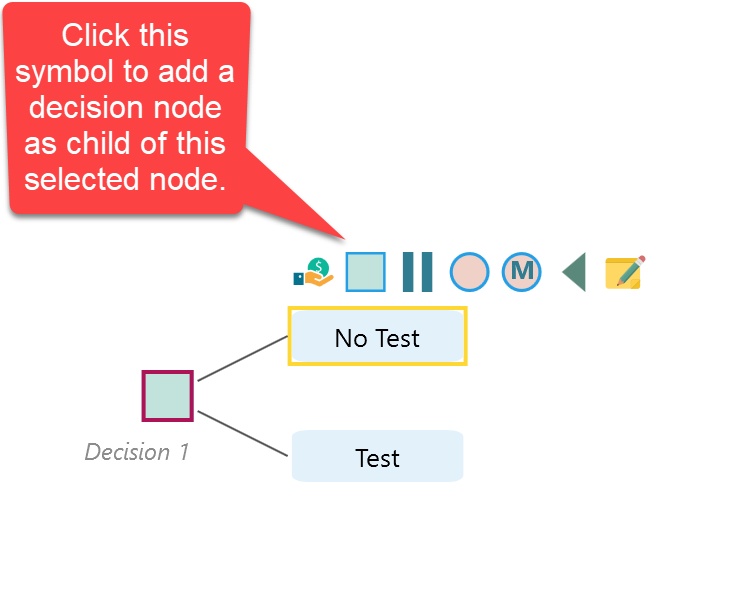
You do not need to memorize every symbol. Decision Tree Pro shows tooltips throughout the diagram. Hover over a button to see what it does.
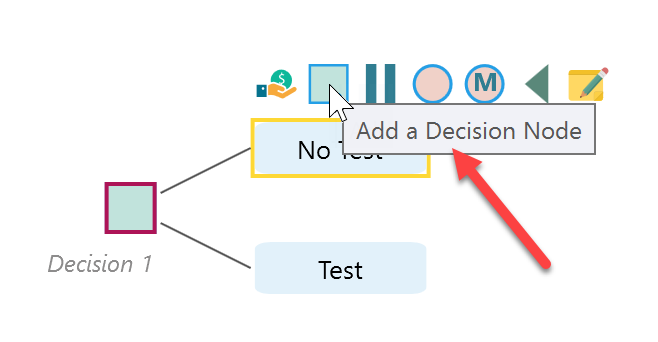
Click the button shown above to add a child decision node.
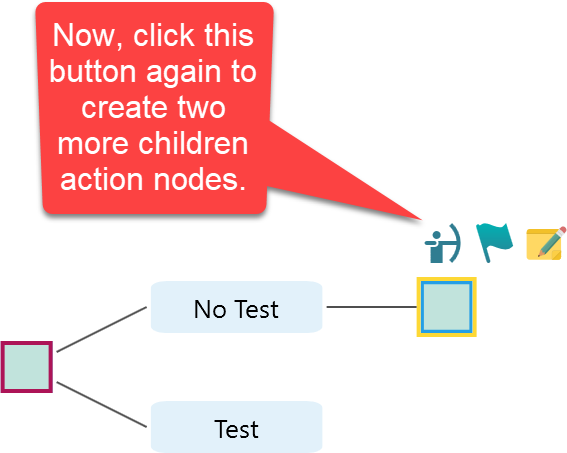
As before, add two more actions under this new decision node and name them "Treatment A" and "Treatment B".
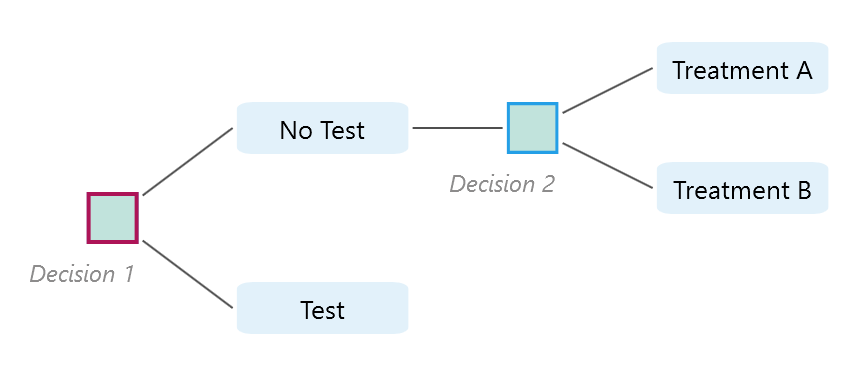
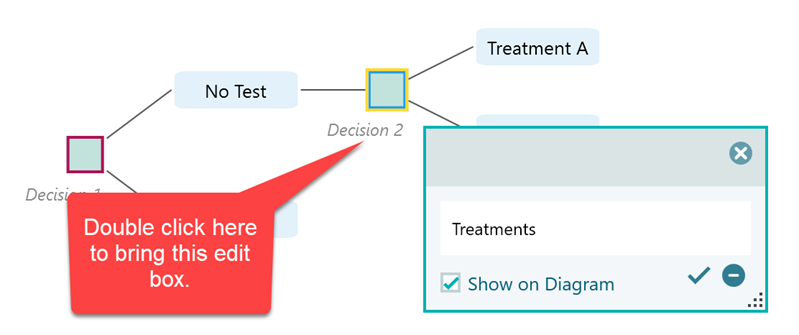
Decision nodes are named Decision 1, Decision 2, and so on by default. You can double-click a label to rename it to something more meaningful.
If the node labels make the tree feel crowded, hide them from the View menu.
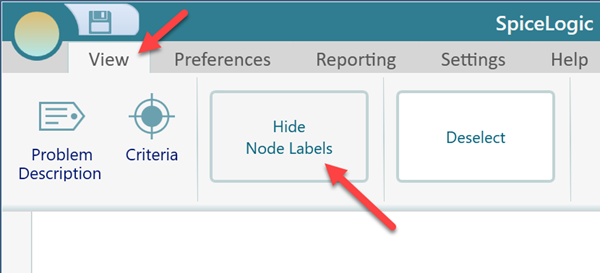
For this tutorial, hide the labels to keep the tree clean.
Adding a Chance Node and Events with Probabilities
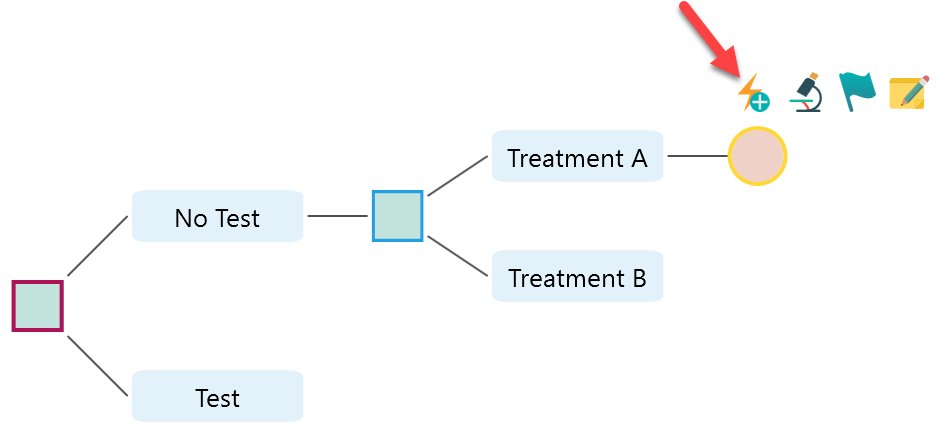
Select the "Treatment A" action under the new decision node. The fly-over menu appears again. This time, click the circle symbol to add a chance node.
After you add the chance node, select it to show its fly-over menu. From that menu, add two event nodes.
The software only shows valid child node types in the fly-over menu.
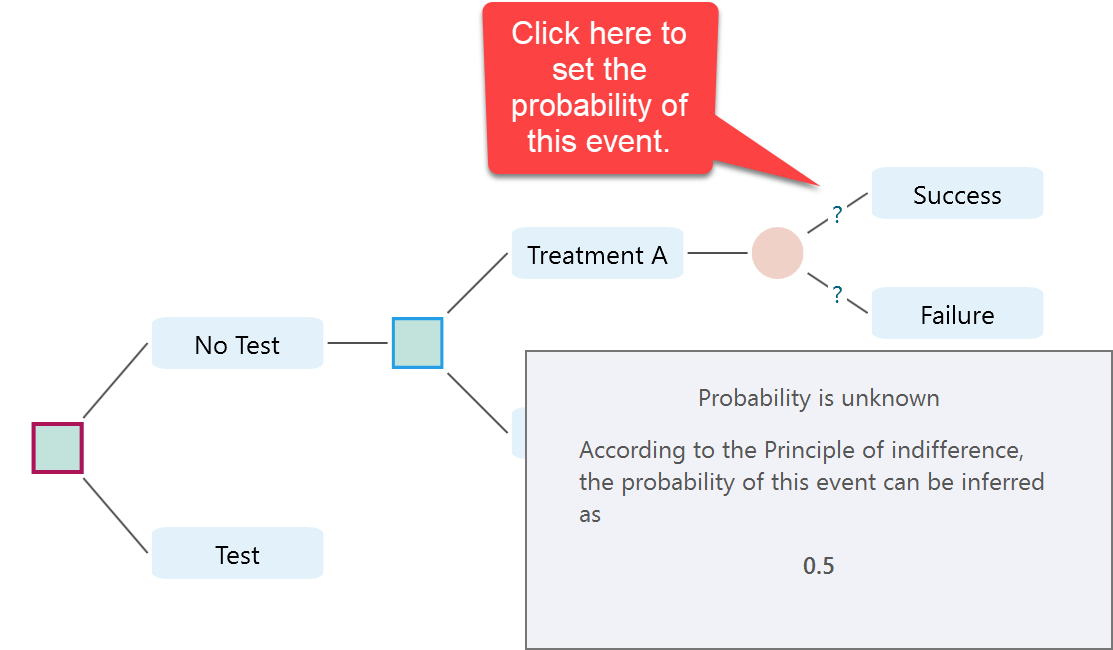
After adding the two events, double-click the event nodes and rename them "Success" and "Failure". The question mark on the edge means the probabilities are still unknown.
When probabilities are unknown, the software uses the principle of indifference for calculation. If there is no reason to believe one event is more likely than another, the events are treated as equally likely. With two events, that means each event has a probability of 0.5. The tooltip explains this as well.
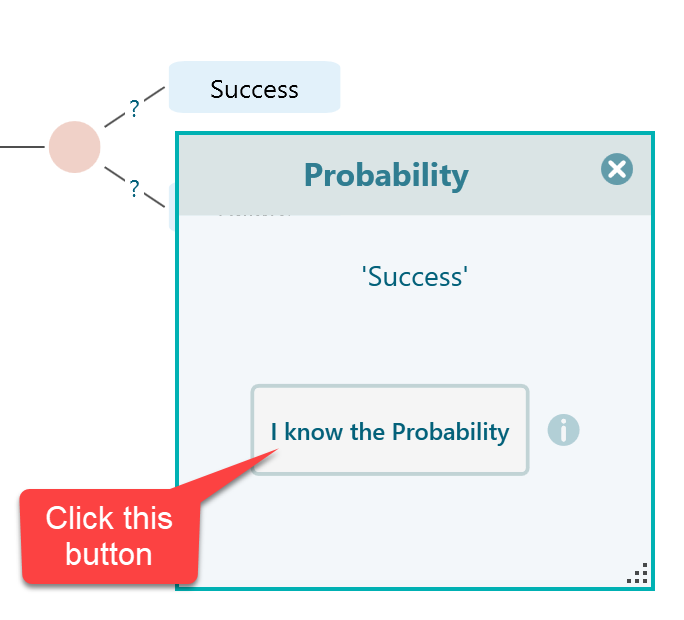
Click the question mark to specify a probability. A message box appears. Click "I know the probability".
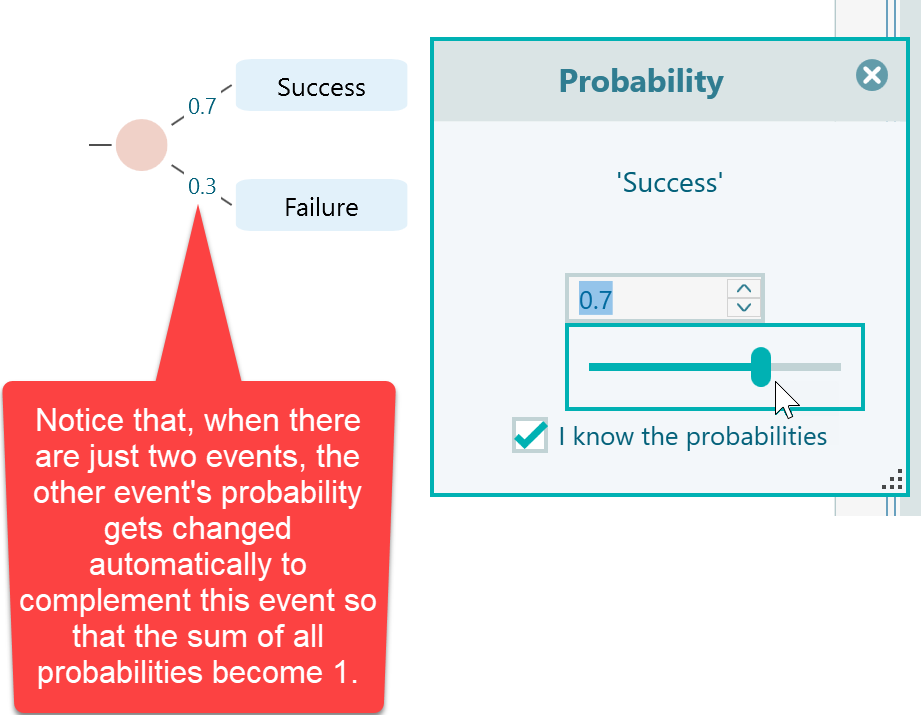
Set the probability of Success to 0.7. The Failure probability is then calculated as 0.3.
Copying and Pasting
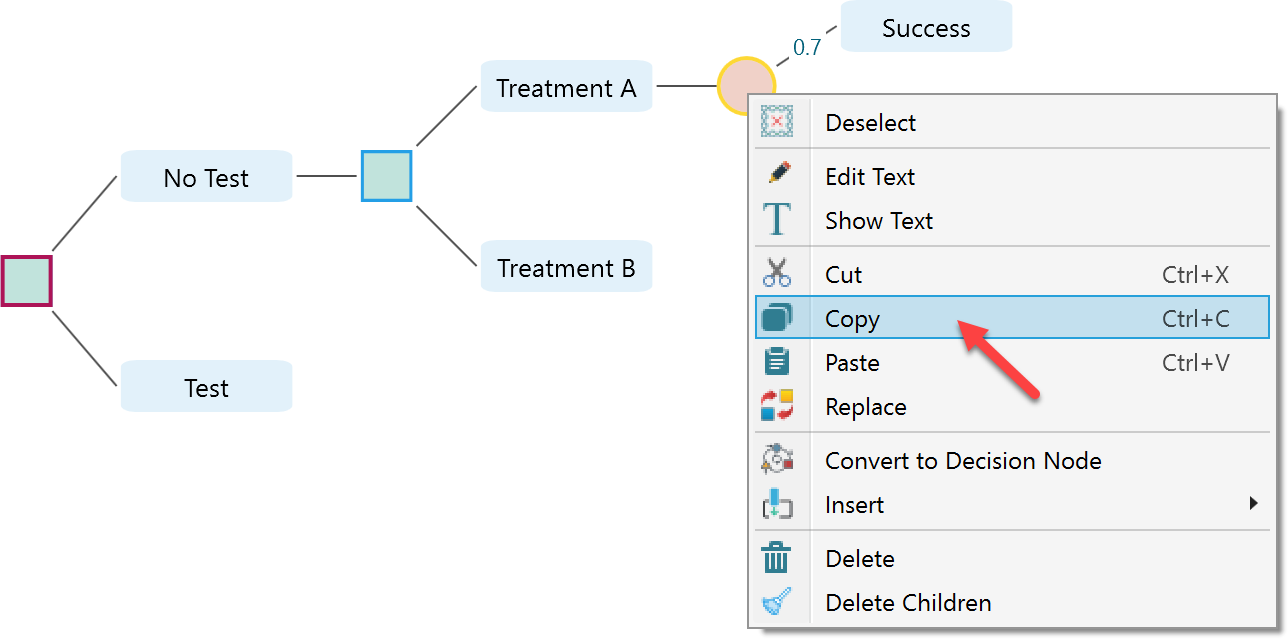
Now comes the useful part. Select the chance node and right-click to open its context menu. Choose Copy. You can also use the keyboard shortcut Ctrl+C.
Select the "Treatment B" node and right-click to open its context menu. This time, choose Paste. You can also use Ctrl+V. After pasting the chance node, the tree will look like this.
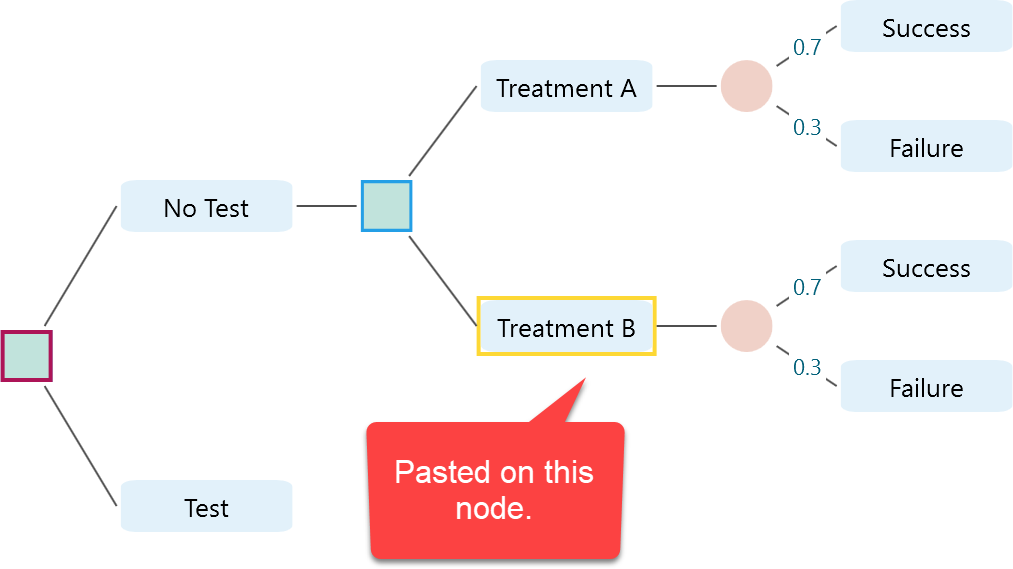
After pasting, update the pasted probabilities to 0.8 for Success and 0.2 for Failure.
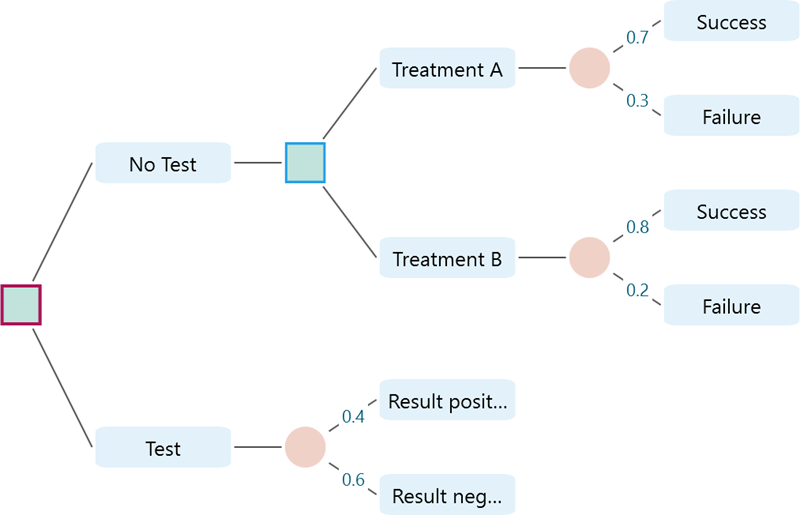
Now select the "Test" action node and add a chance node. Add two events under it: "Result Positive" and "Result Negative". Set the probability of Result Positive to 0.4 and Result Negative to 0.6.
You may be wondering where these numbers come from. They are simply the sample values from the decision tree shown at the beginning of this tutorial. They are not fixed rules. For your own model, use values that fit your situation, data, or expert judgment.
If you followed the steps, your tree should now look like this.
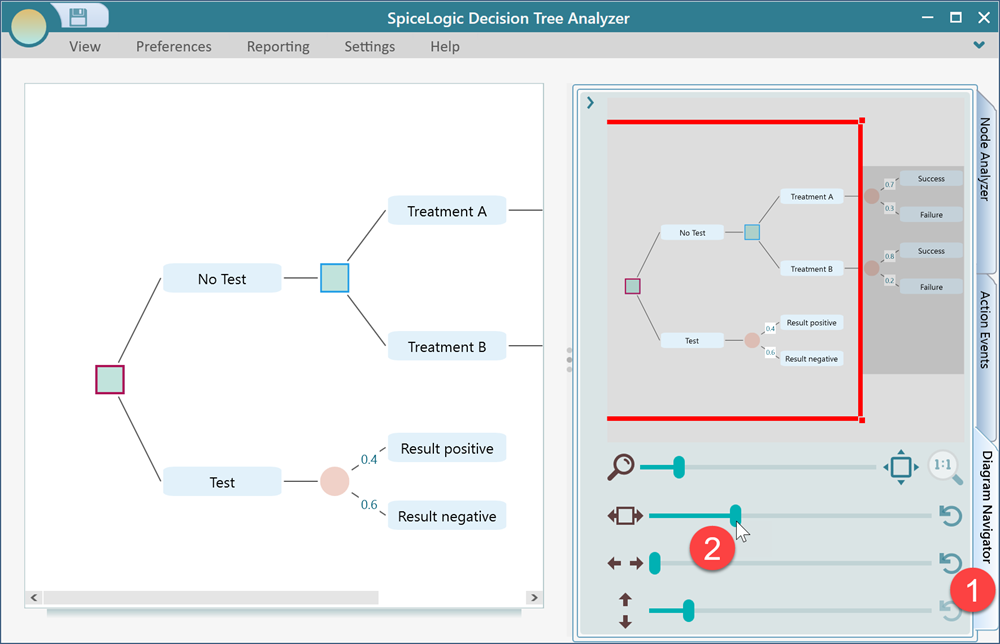
If the Result Positive and Result Negative nodes do not show their full text, the node width is too narrow. Expand the Diagram Navigator tab and use the node-width slider. This panel also includes controls for horizontal spacing, vertical spacing, zoom, and other diagram layout options.
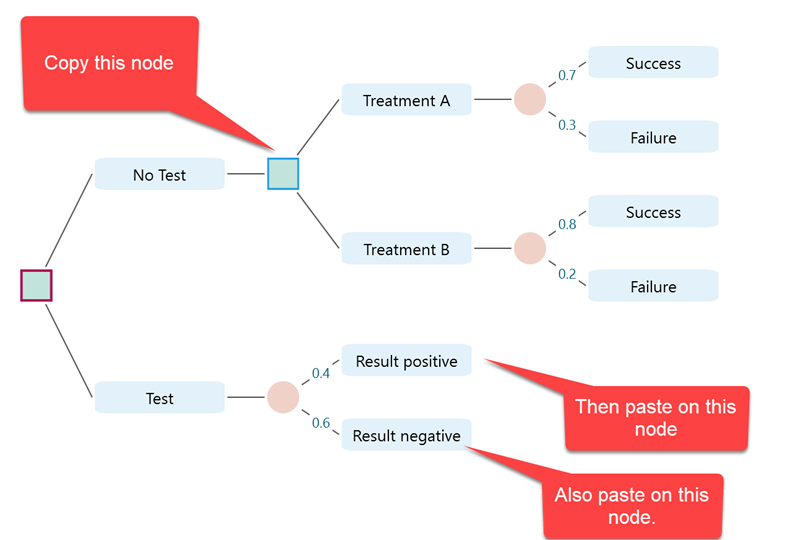
After increasing the width, the full node text is visible. Now copy the decision node that contains "Treatment A" and "Treatment B", then paste it under each event of the result chance node: Result Positive and Result Negative.
At this point, the tree should match the sample decision tree shown at the beginning of the tutorial. Now update the probabilities. Because the nodes were copied and pasted, their probabilities came from the original subtree. Select each edge and set the probabilities from the sample diagram.
After the probabilities are corrected, the decision tree should look like this.
Setting Payoff
Now add payoffs. In this example, the payoff is measured in life-years received by the patient after treatment.
Click the top "Success" node and look at its fly-over menu.
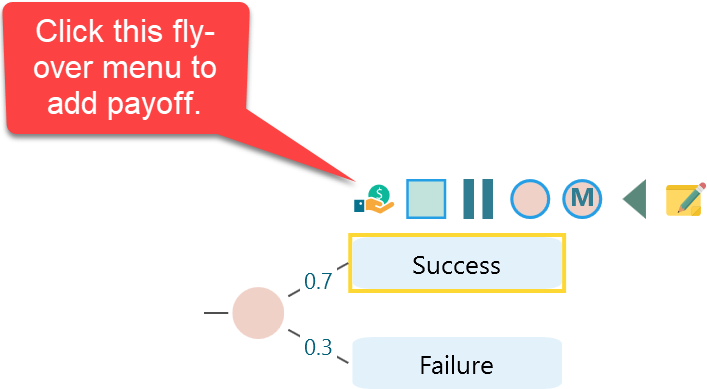
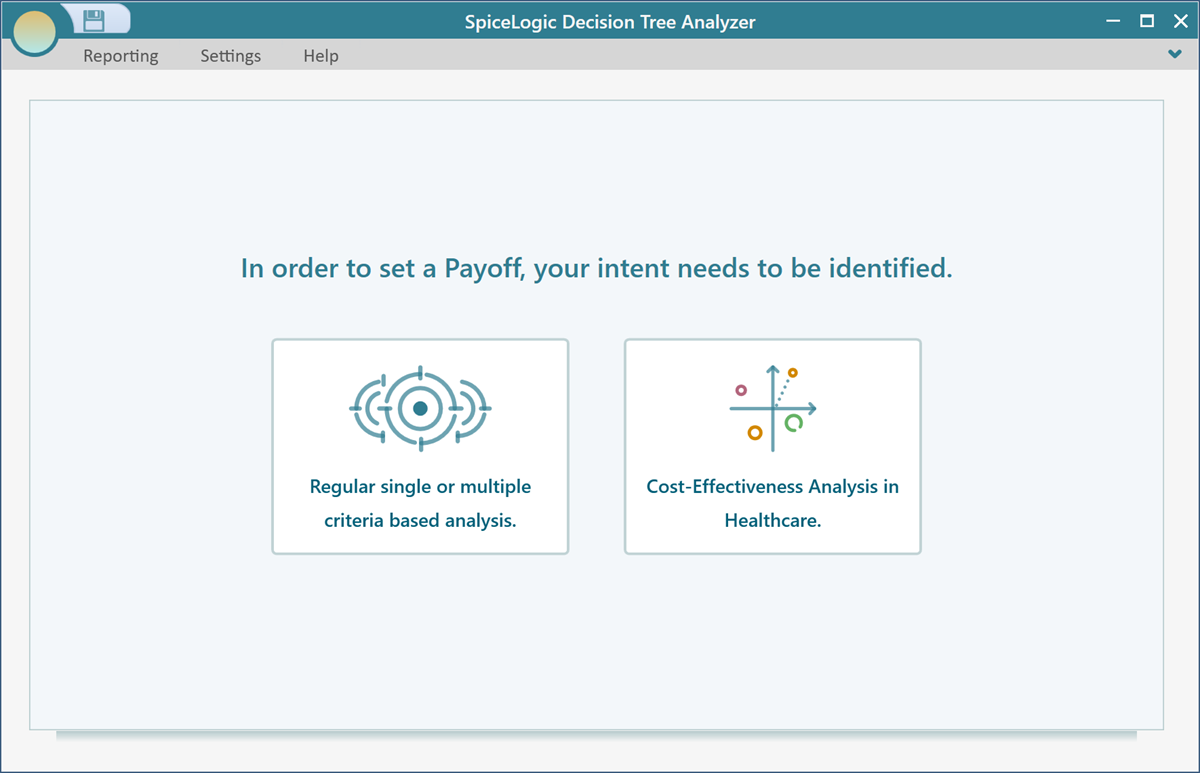
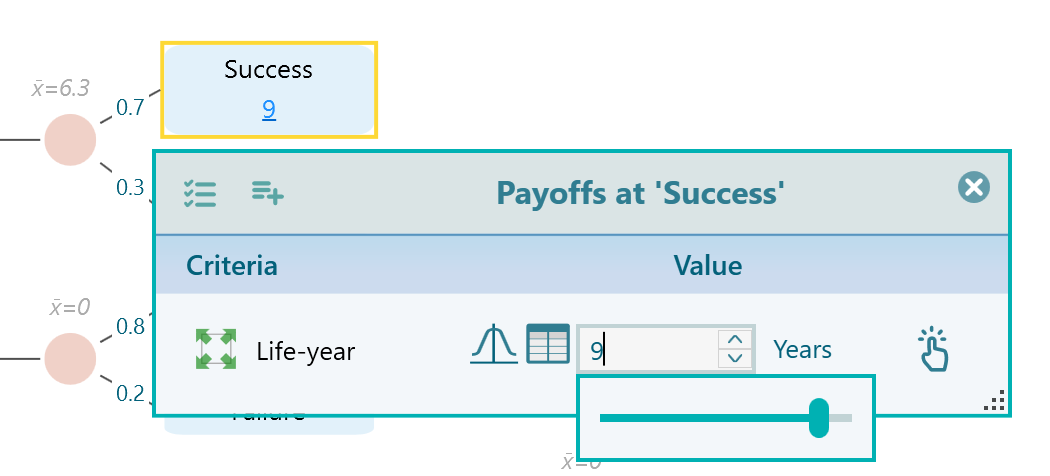
Click the payoff button. The first time you add a payoff, the software asks what type of payoff you want to use. It can be numeric, subjective, Boolean, or cost-effectiveness based.
For this tree, the payoff is a simple numeric criterion: life-years. Choose "Regular single or multiple criteria based analysis".
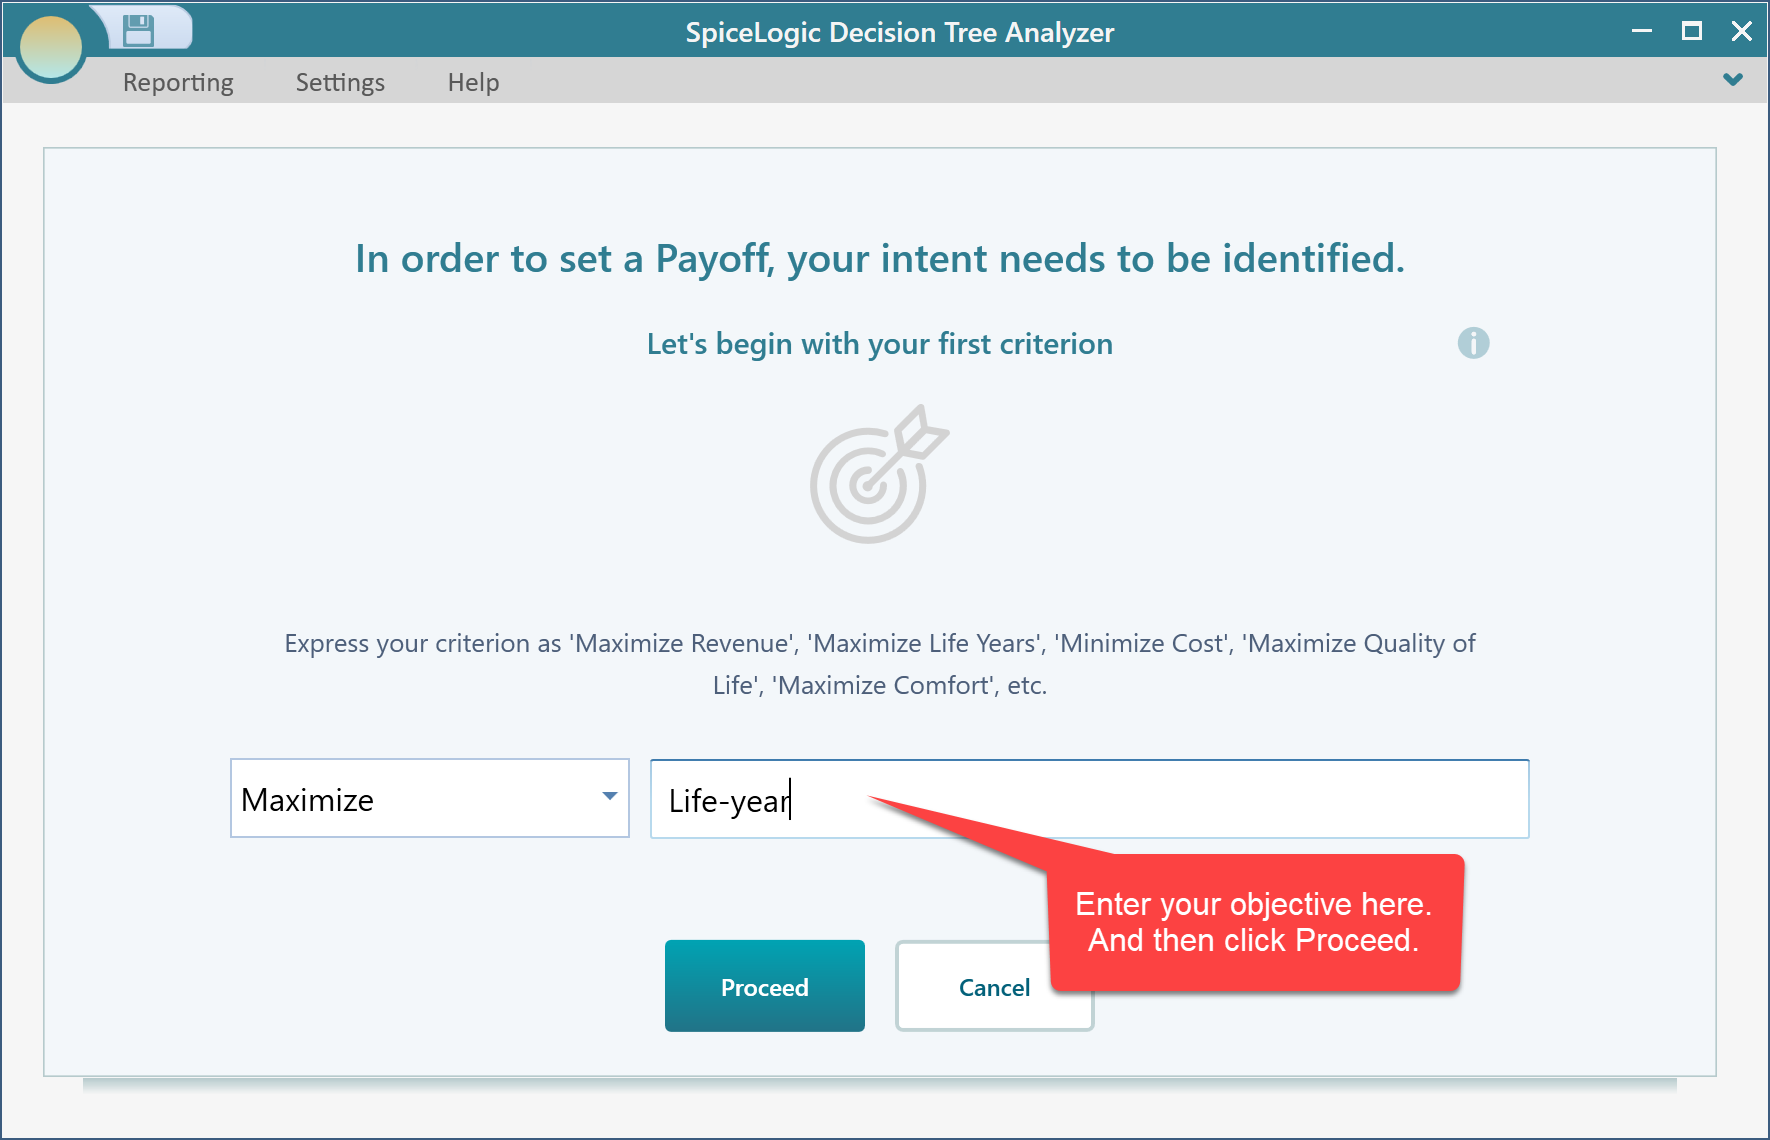
After clicking the first button, you will see the next setup window.
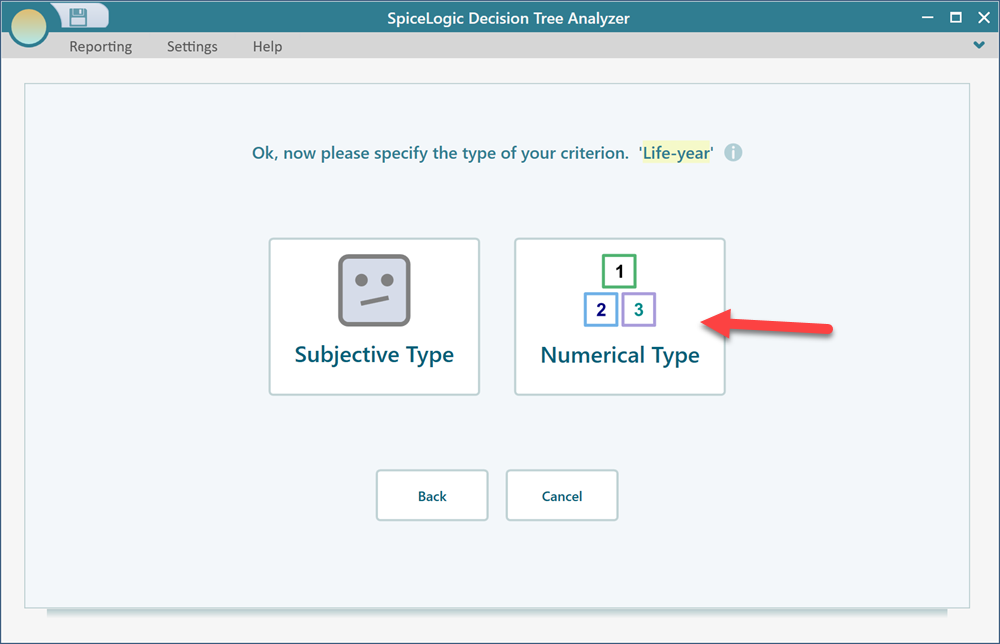
Select "Number Type" for this criterion.
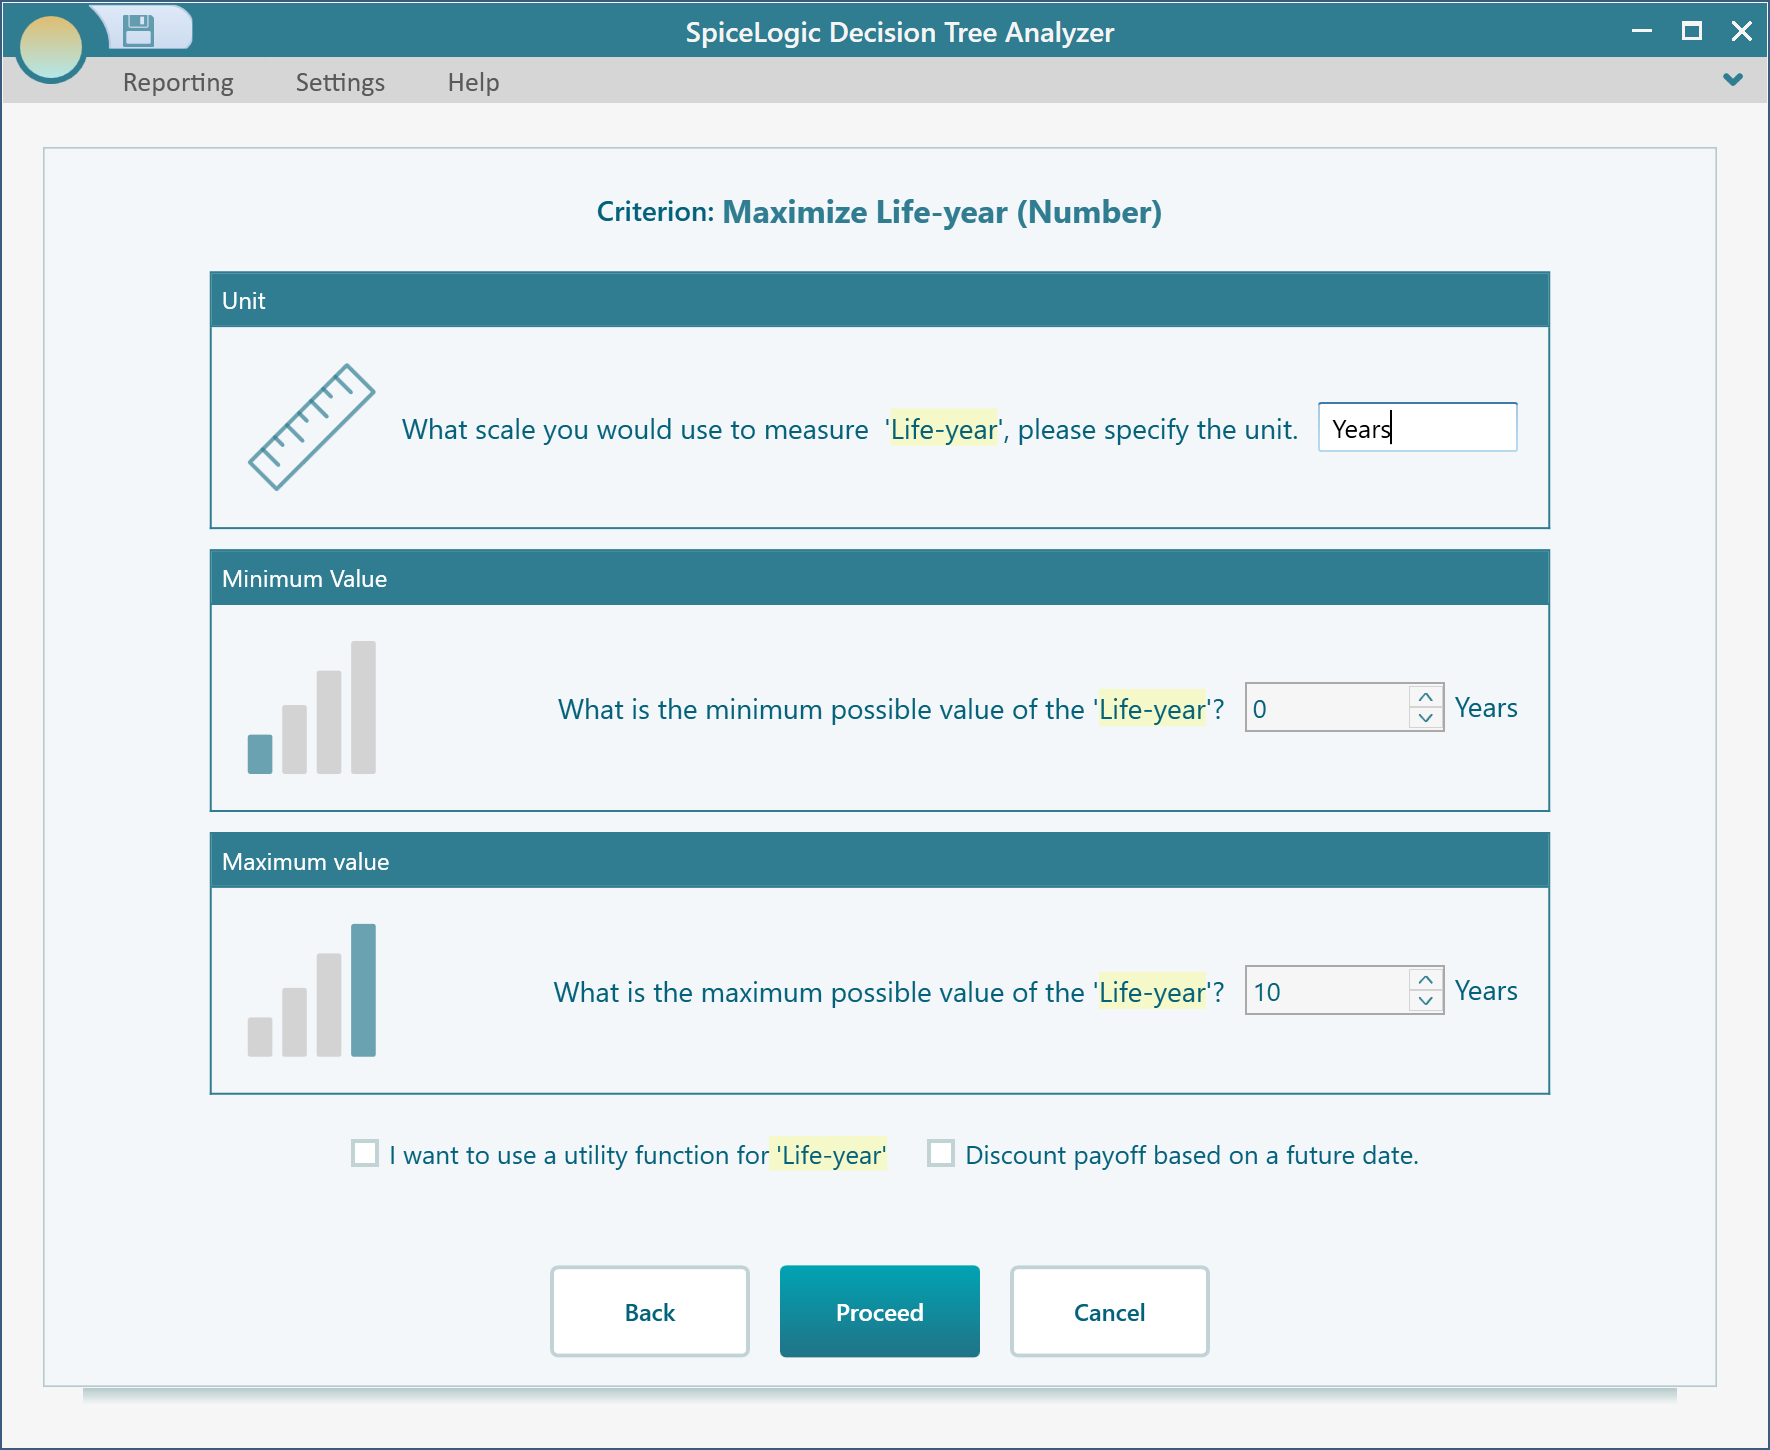
Set the unit to "Years". In this example, the minimum possible life-year value is 0 and the maximum is 10. Enter those values and click "Proceed".
After clicking "Proceed", the wizard asks whether you want to add another criterion. Choose "No". You will return to the decision tree, and the top Success node will show the payoff editor.
Set the payoff to 9 years, using the value from the reference diagram.
Set the payoff for all Success and Failure nodes using the values from the reference diagram. After the payoff type is configured, clicking the payoff button opens the payoff editor directly.
Terminals
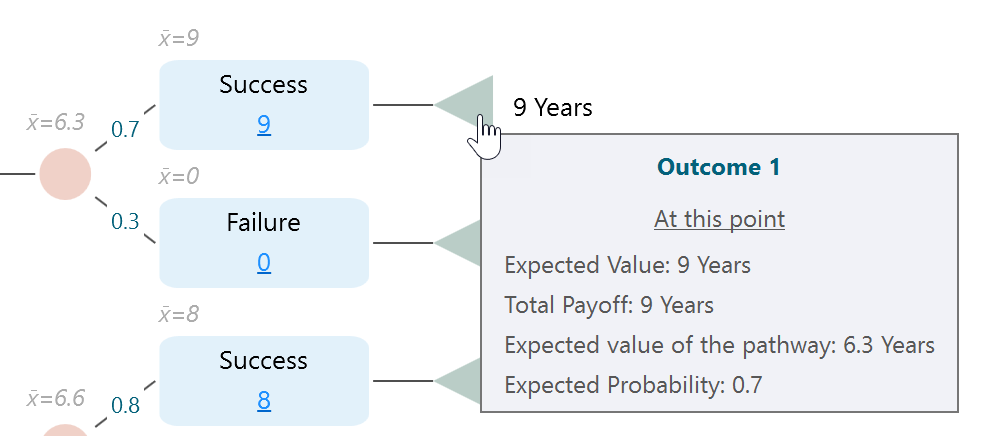
Select each Success and Failure node and add a terminal node from the fly-over menu. The terminal node displays the total payoff at that point.
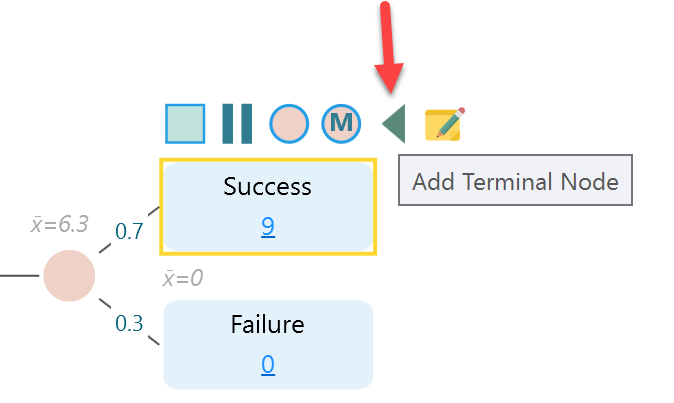
The terminal node also shows useful metrics in its tooltip.
Analyzing Results and Policy
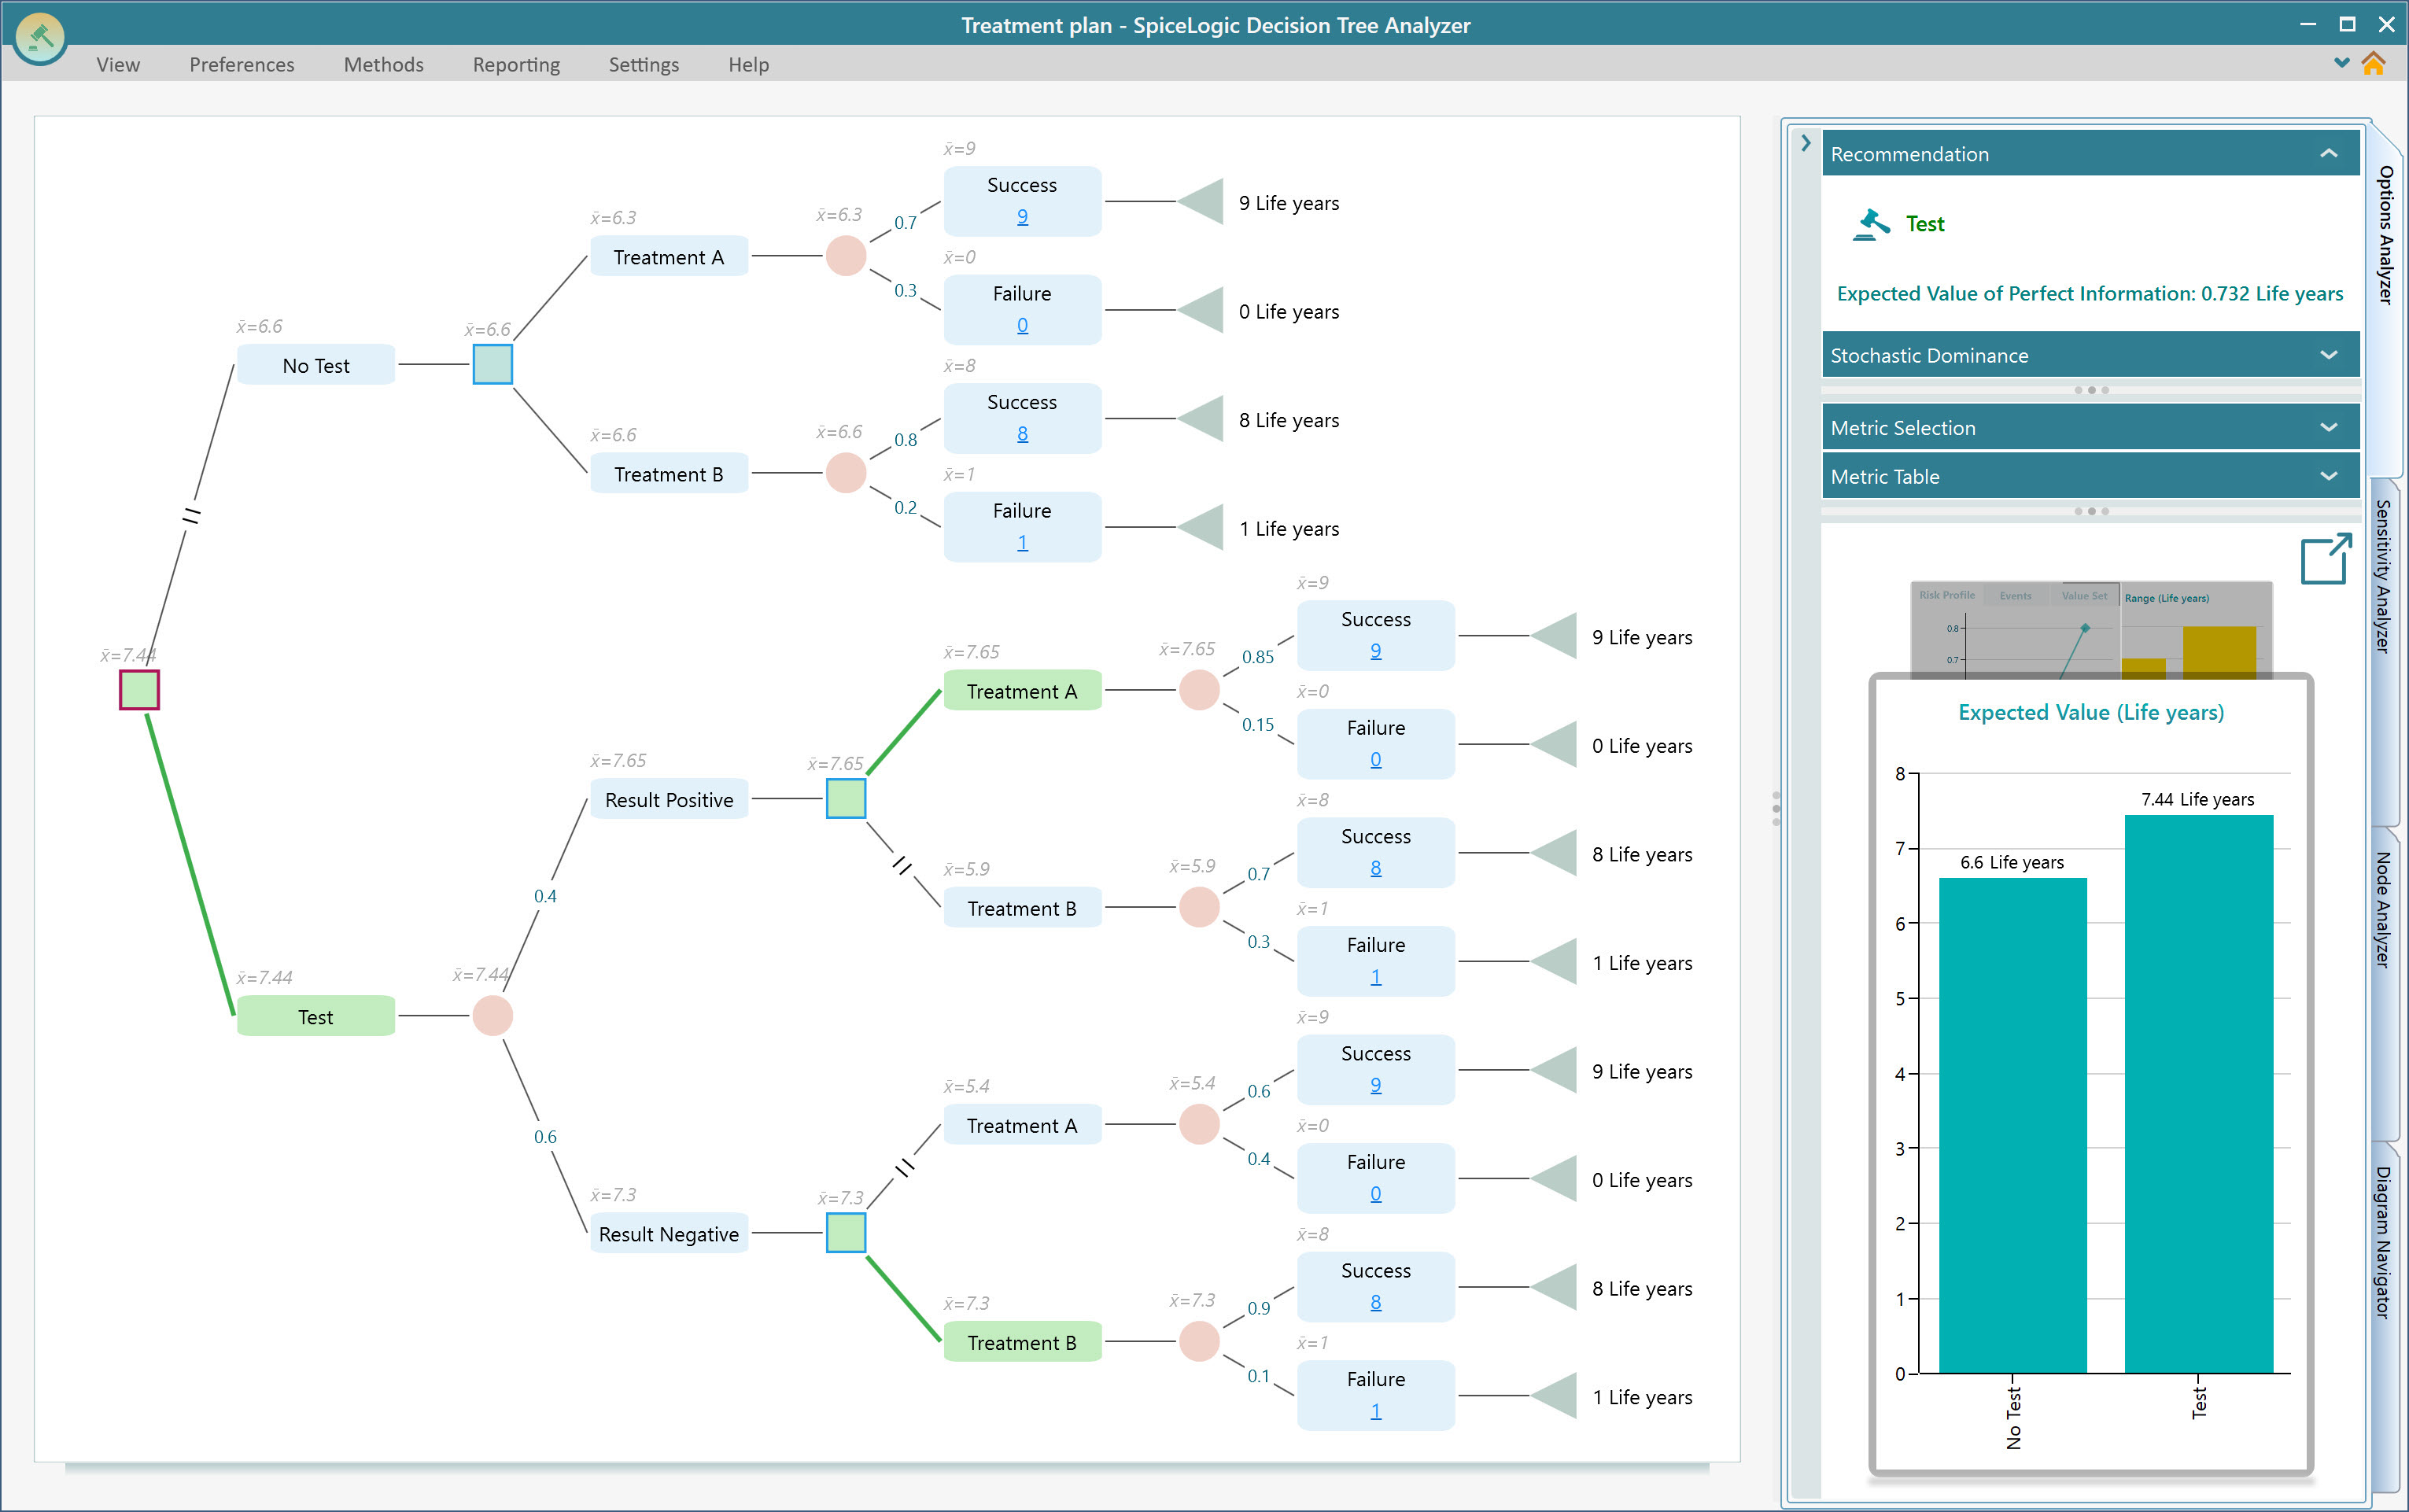
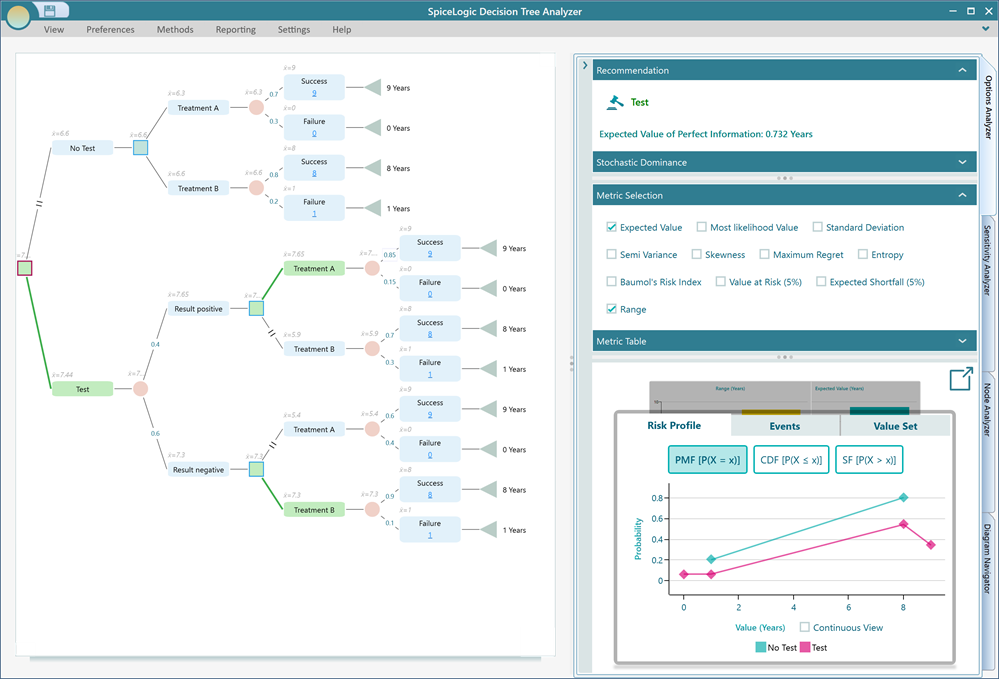
After the payoffs are set, the decision tree calculates the result immediately. Expected values are displayed on the nodes.
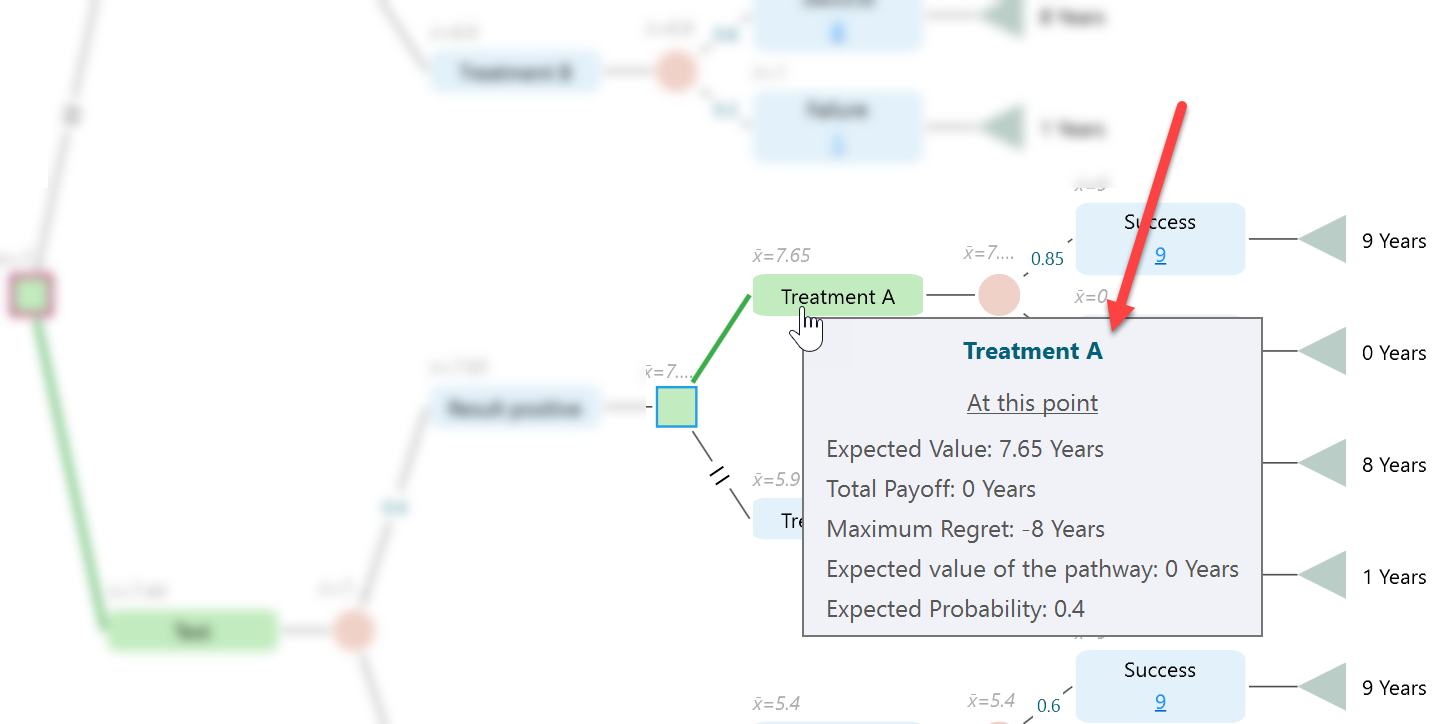
The recommended path is highlighted in green. In this example, the expected value for the "Test" node is 7.44 life-years, compared with 6.6 life-years for "No Test". So the root decision recommends "Test".
The green path is also shown for later decisions, such as the action to take after a positive or negative test result. This is called a policy: the recommended action for each situation in the tree.
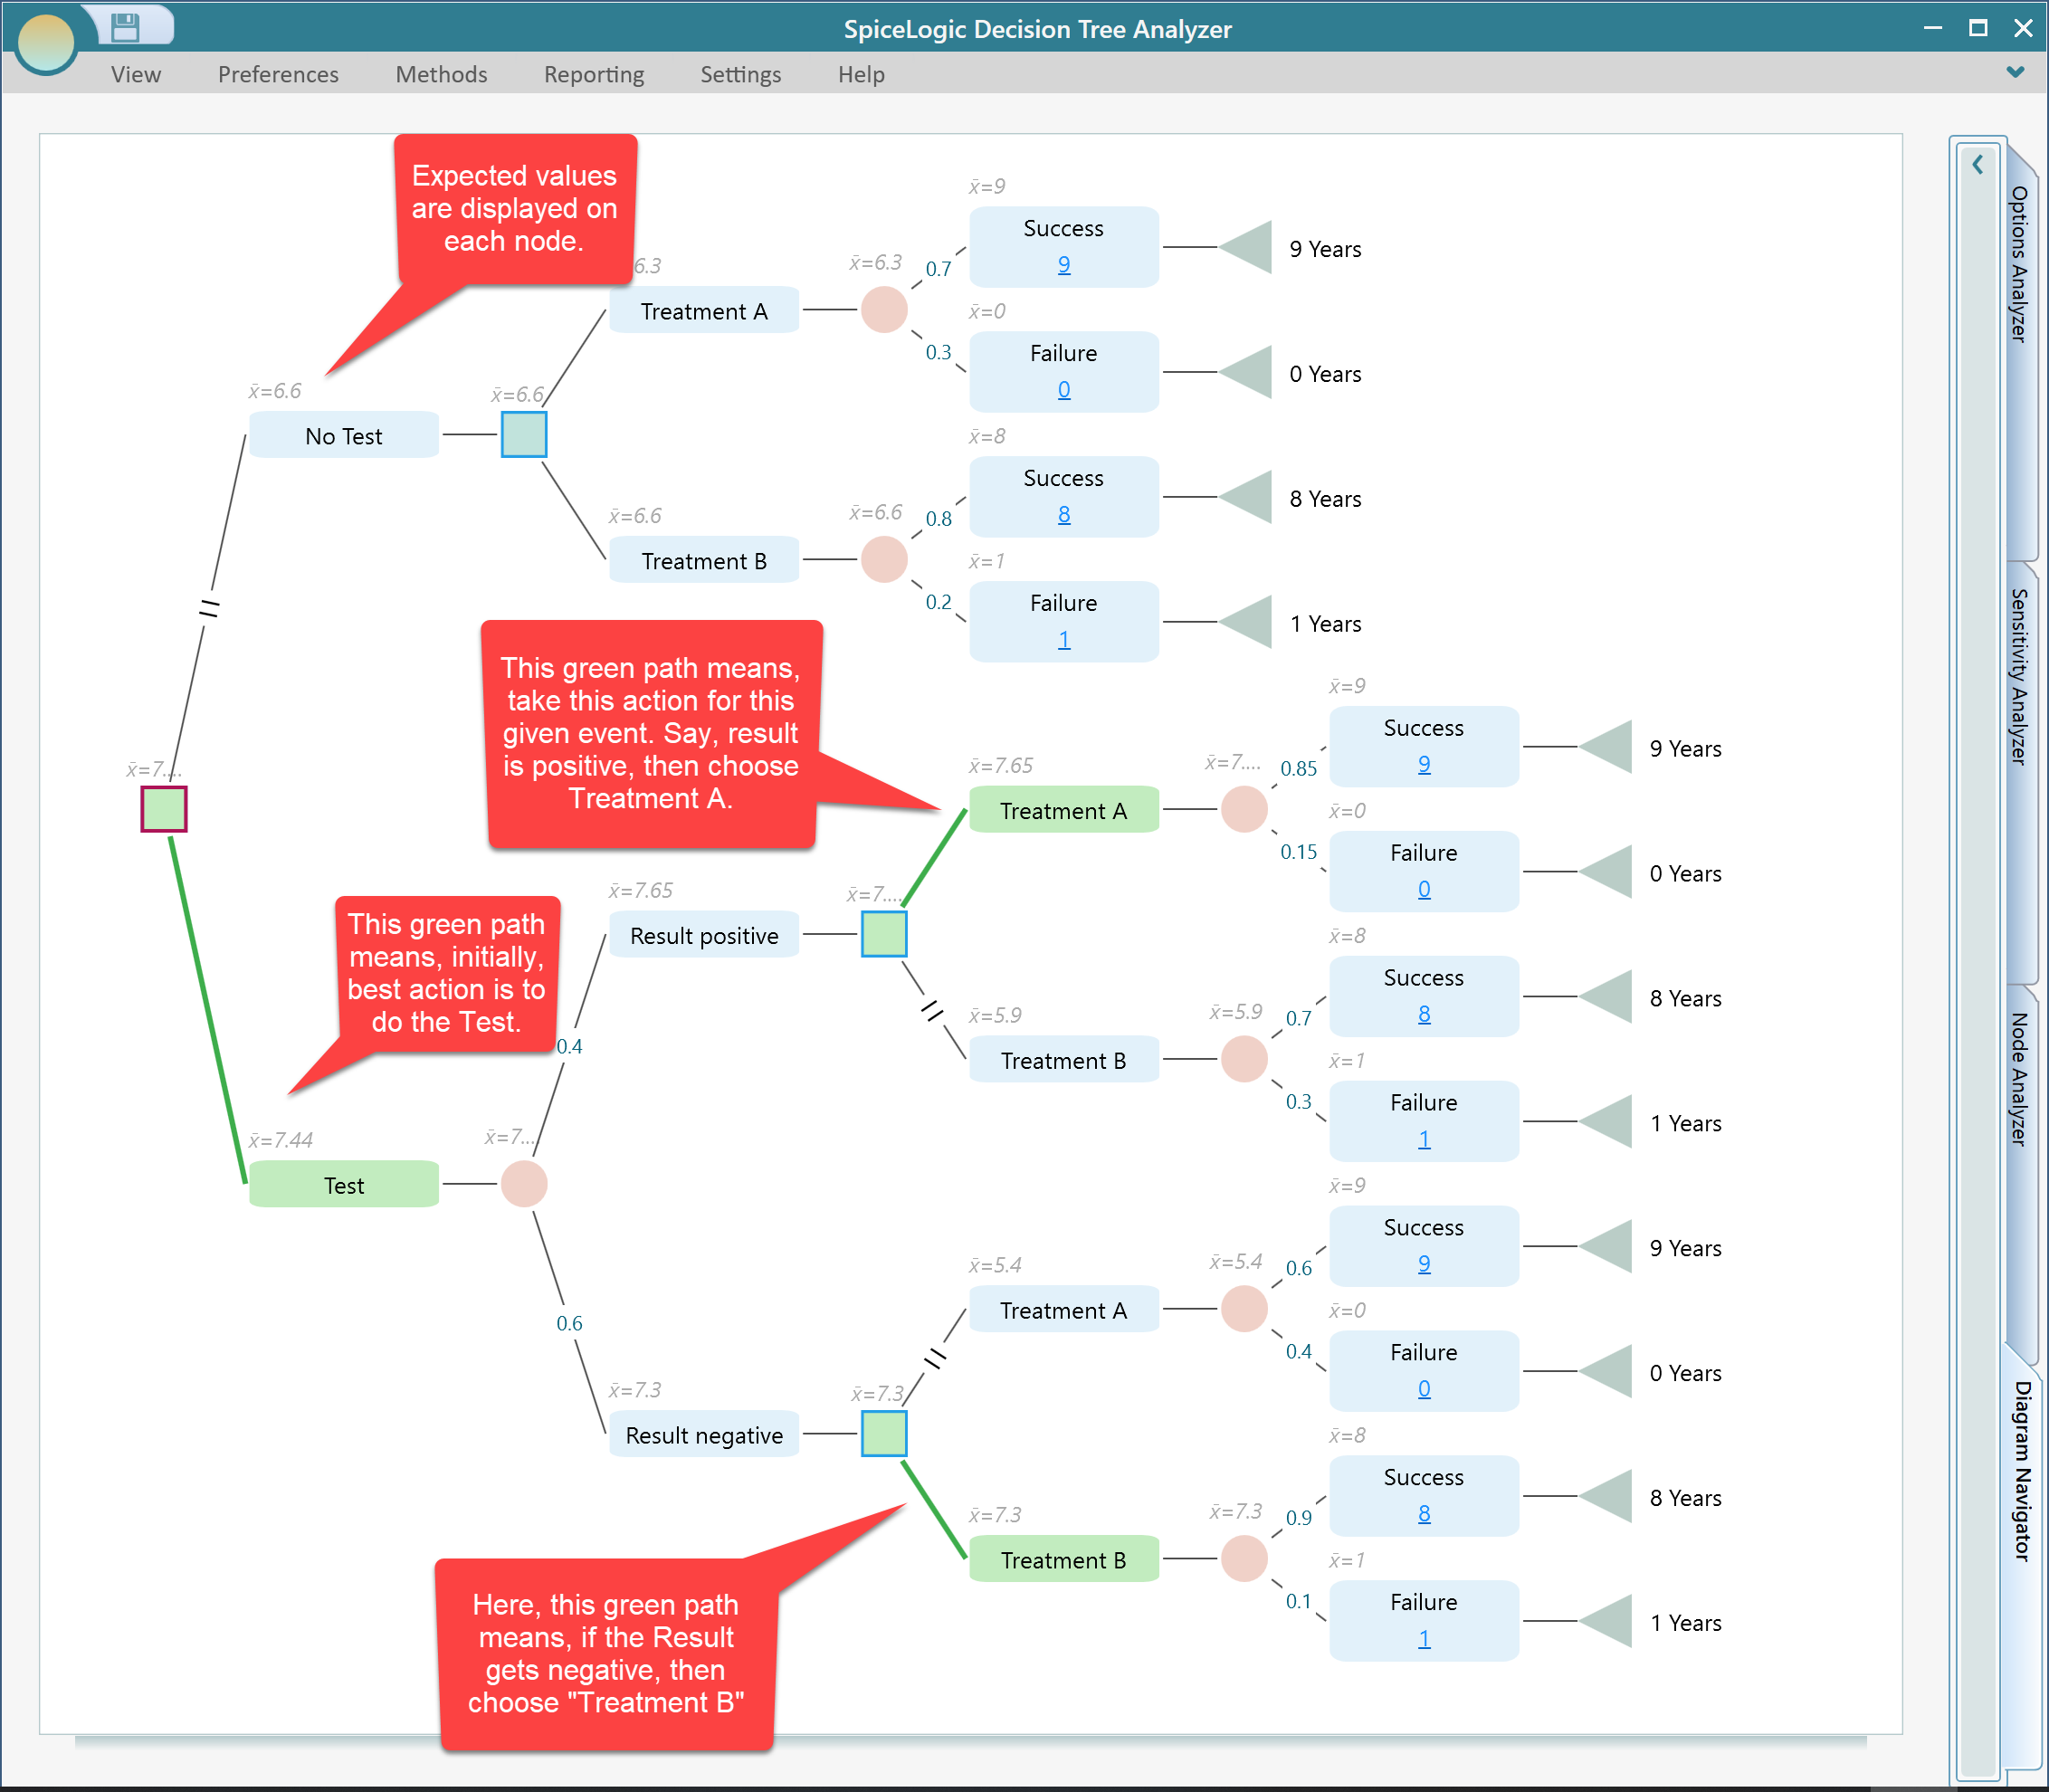
The tooltip for each node also shows metrics such as expected value, total payoff at that point, and expected probability.
Expand the Options Analyzer tab to view charts and additional metrics.
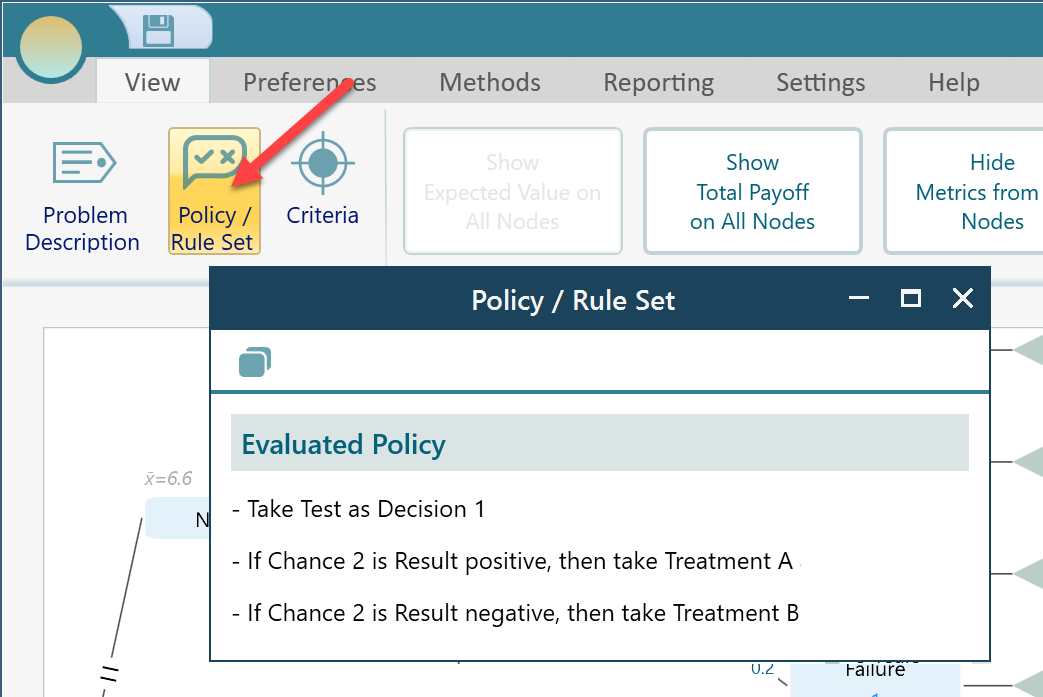
From the View menu, click "Policy/Ruleset" to see the policy as text instructions.
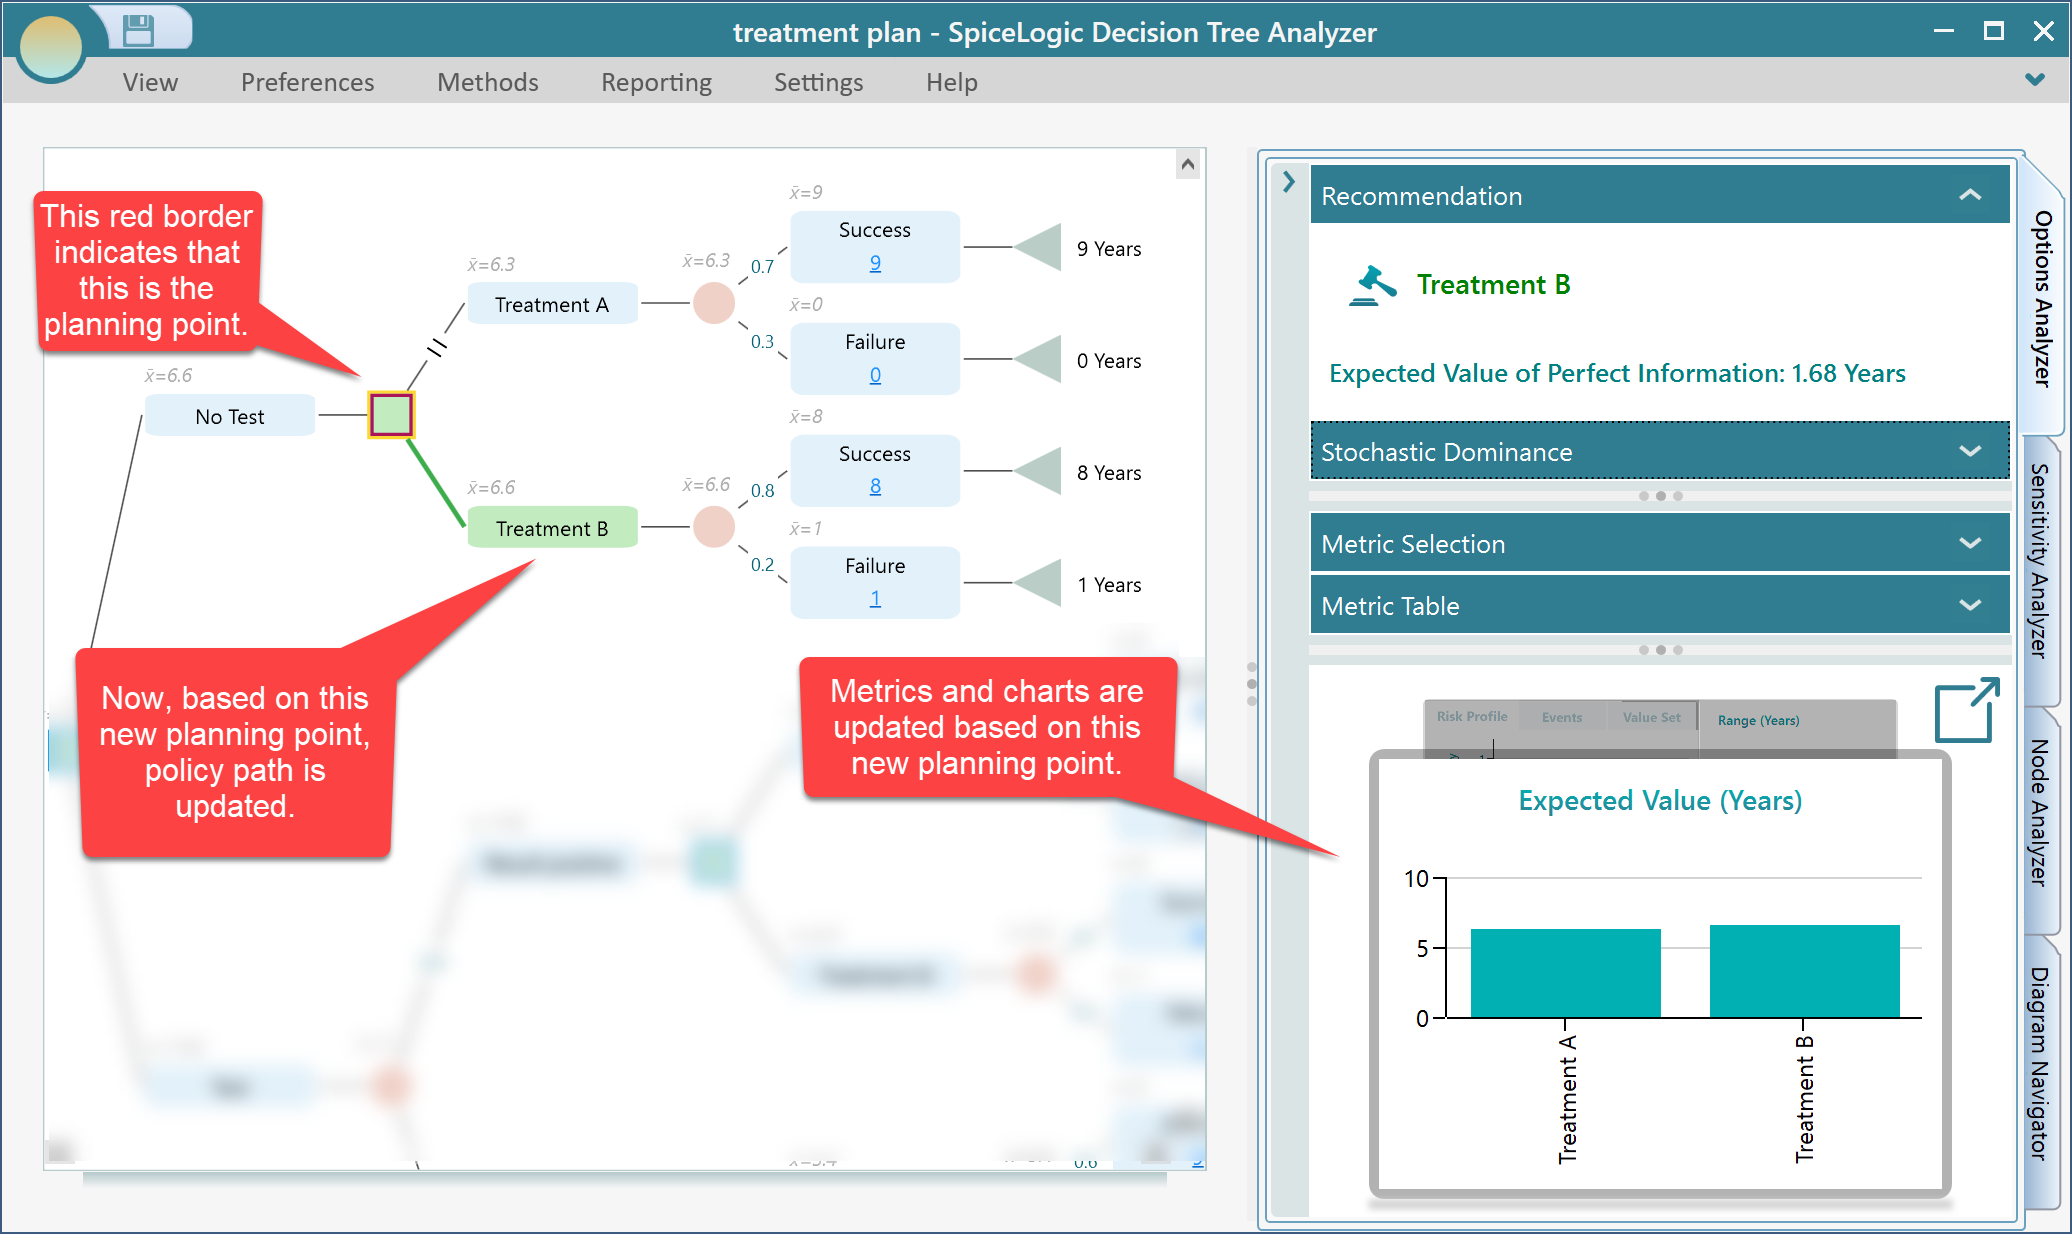
Planning Point
Now suppose you want to analyze the tree from a later point. For example, what if the "No Test" path has already happened and you now need the best policy from that point?
You can do this by changing the planning point. The current planning point is the root node. Select the decision node that comes after the "No Test" action. In its fly-over menu, click the flag button to set that node as the planning point.
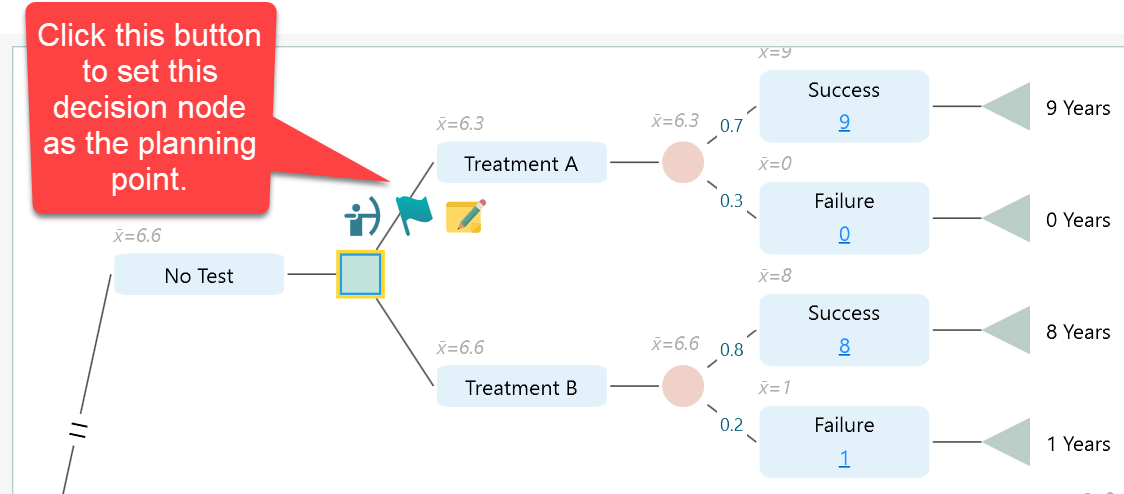
After setting the planning point, the tree is recalculated from that node. The green policy path starts from the new planning point, and the metrics and charts update accordingly.
Conclusion
This tutorial only scratches the surface, but it covers the basic workflow: create decision and chance nodes, enter probabilities, set payoffs, read the expected value result, and inspect the recommended policy. Continue through the other documentation pages to explore risk metrics, utility functions, sensitivity analysis, Markov models, cost-effectiveness analysis, and more.