


Gambler's ruin
This is the classic "Gambler's Ruin" problem. It is a nice, simple way to see what a Markov Chain can tell you. The story goes like this. A reluctant gambler gets dragged to a casino by his friends. He brings only $50 to play with. He does not know much about gambling, so he picks roulette and keeps it easy. On every spin he puts $25 on red. If red comes up, he wins $25. If black comes up, he loses that $25. Red and black are equally likely, so each spin is basically a coin flip, about a 50% chance either way.
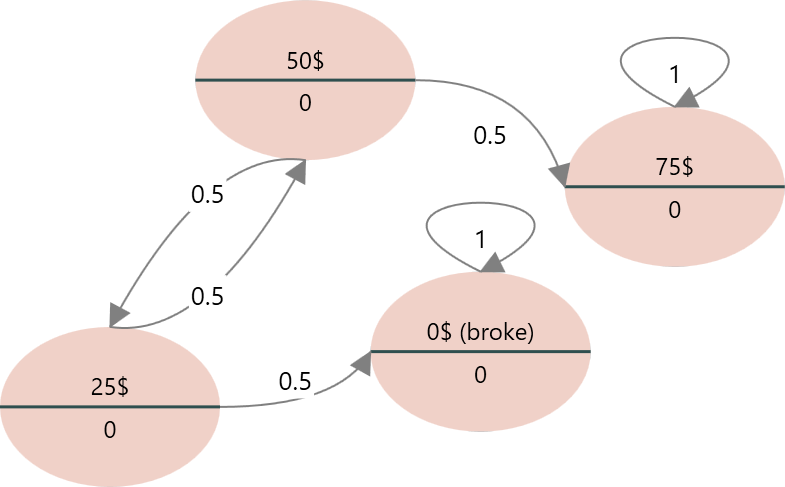
He sets two simple rules for himself. He stops the moment he runs out of money and is down to $0. He also stops if he gets ahead by $25 and has $75 in his pocket. So his money can only ever sit at one of four amounts: $0, $25, $50, or $75. The question is easy to state. Starting from $50, is he more likely to walk out broke, or to walk out with $75? The table below shows the chance of moving from one amount to another on a single spin.
Let's turn this story into a Markov Chain and watch where the gambler tends to end up over many spins. A Markov Chain is a good fit here because the next spin only depends on how much money he has right now, not on how he got there. That is the one rule a Markov model needs.
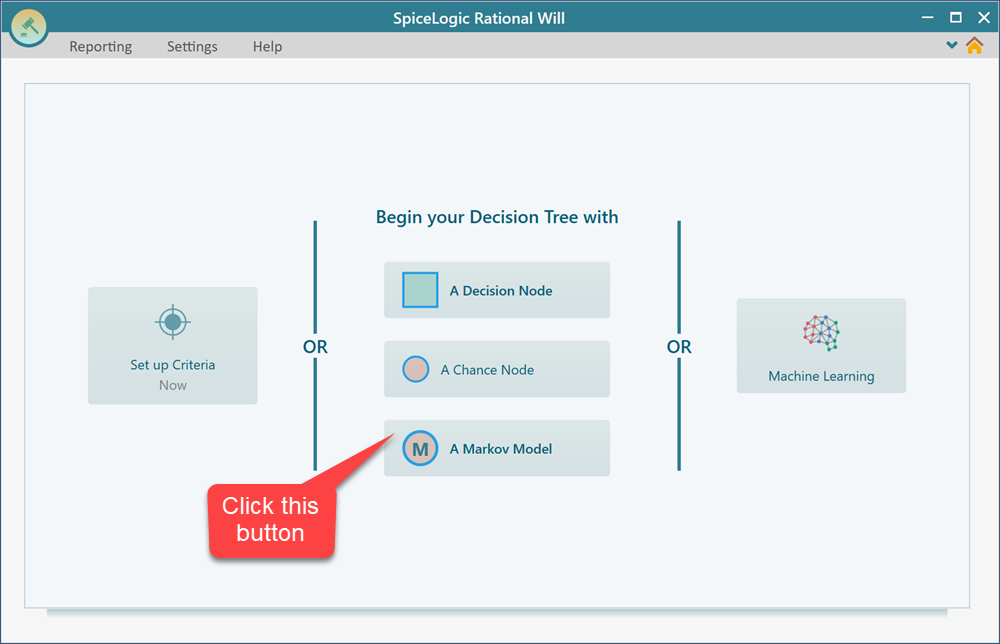
To begin, open Rational Will or the Decision Tree software and start a new Markov Model.
Step 1: List the states
When you click the "Markov model" button, a wizard opens and walks you through the setup one screen at a time. The first thing it asks for is the states. A state is just one situation the gambler can be in. In this problem that is simply how much money he has. There are four of them: $0, $25, $50, and $75. Add these four states exactly as shown below. Type them in the same order so they are easy to read later.

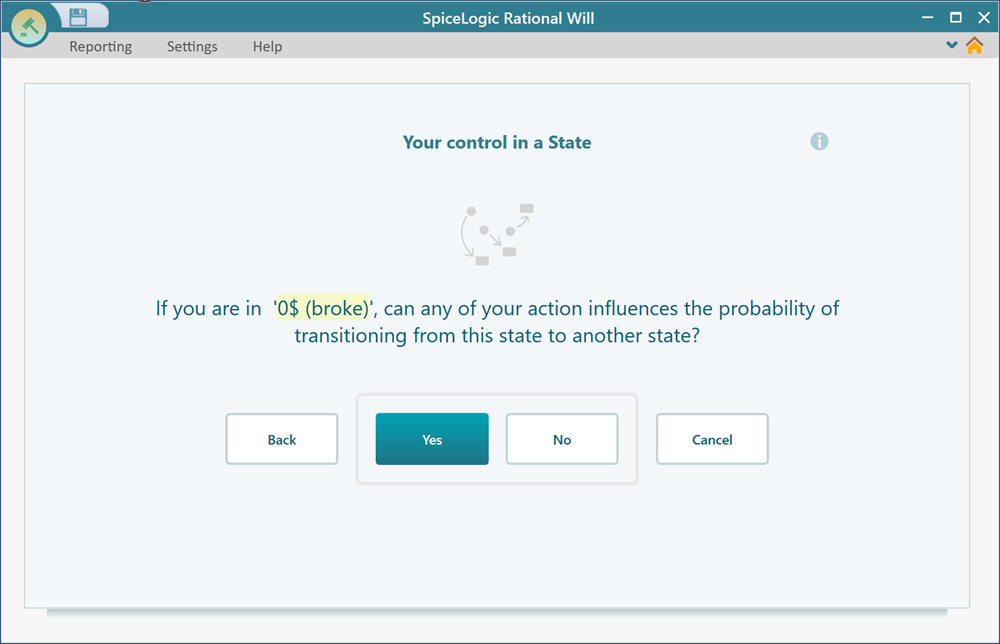
The wizard then asks, for each state, whether you want to attach an Action to it. Actions are for models where you make a decision at a state. A medical example would be choosing to treat or to wait. Our gambler is not making any choices like that. The spin just happens to him. So answer No, and do the same for all four states.
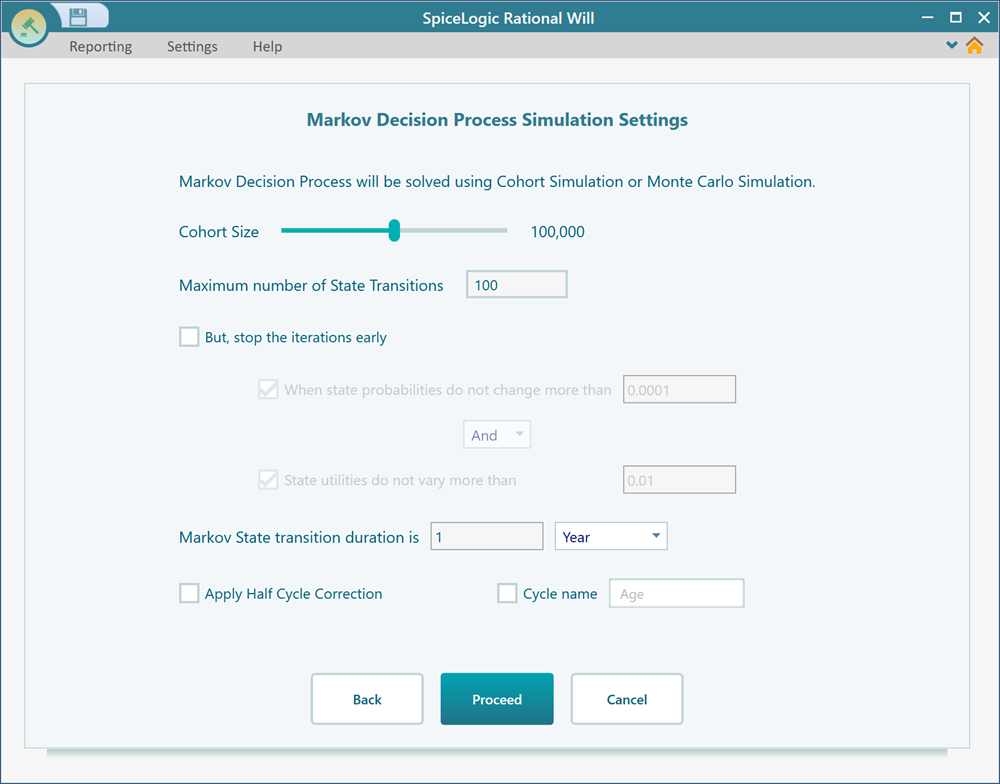
Step 2: Cohort simulation settings
The next screen lets you adjust how the Markov simulation runs, such as how many cycles it steps through. For a small model like this one, the defaults are exactly what you want, so there is nothing to change here. Just click "Proceed" and move on.
Step 3: Enter the transition probabilities
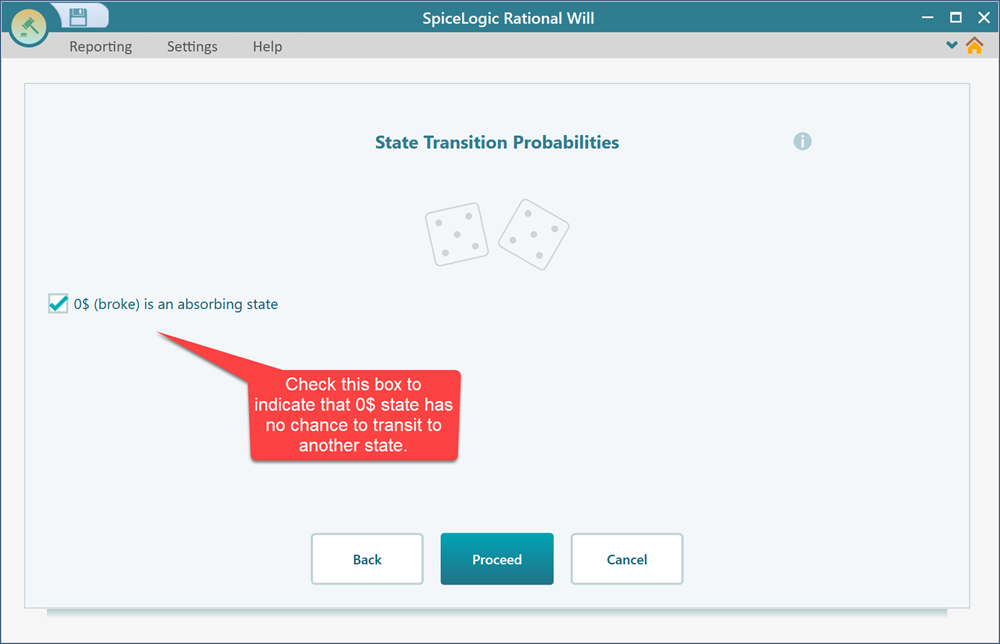
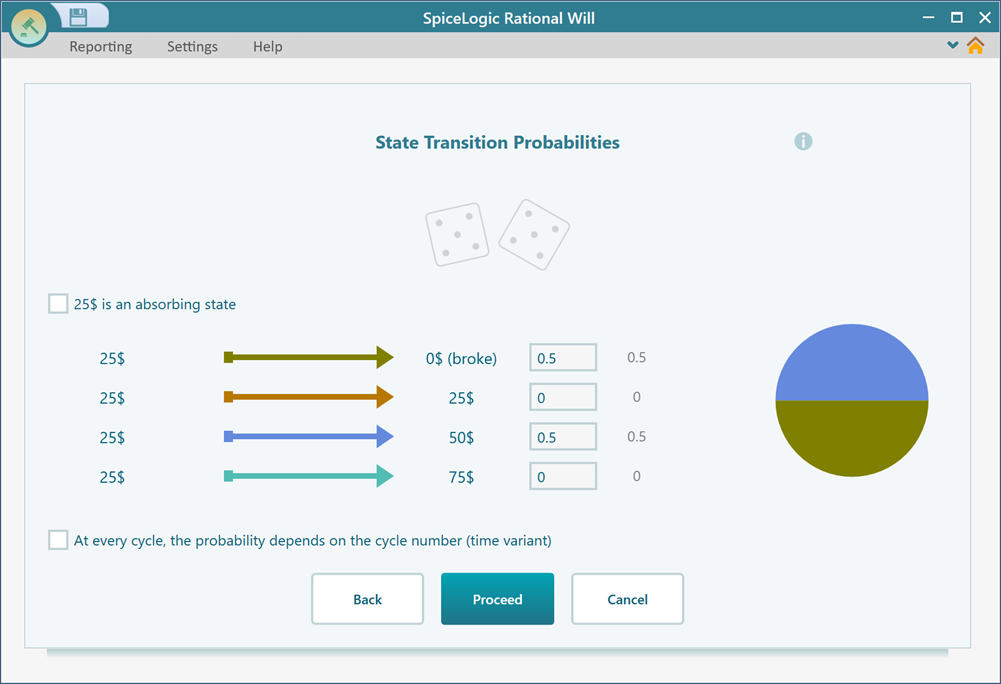
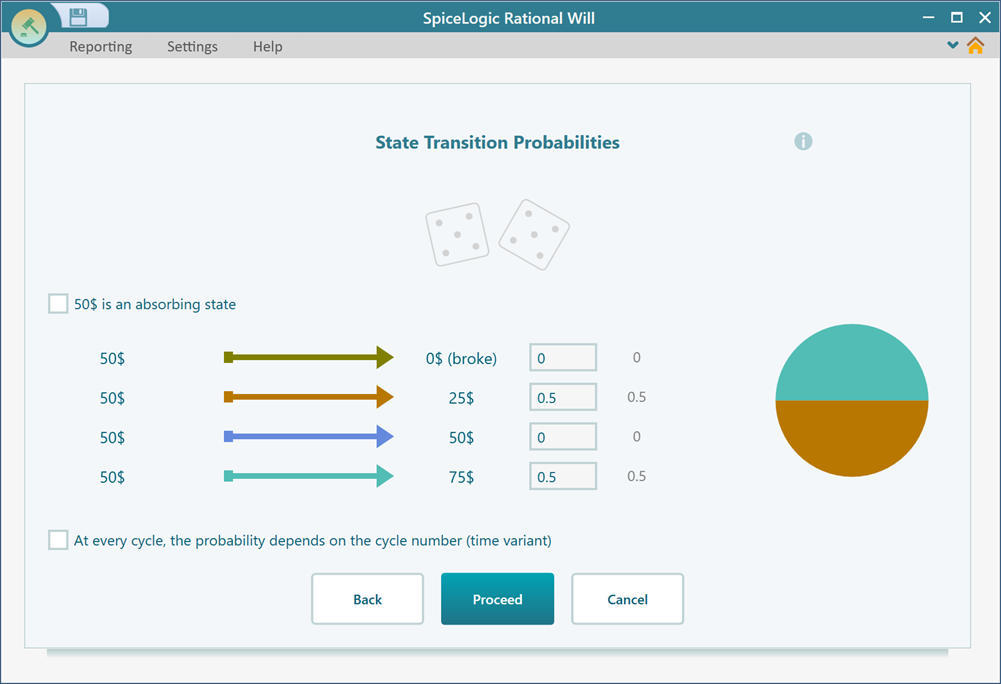
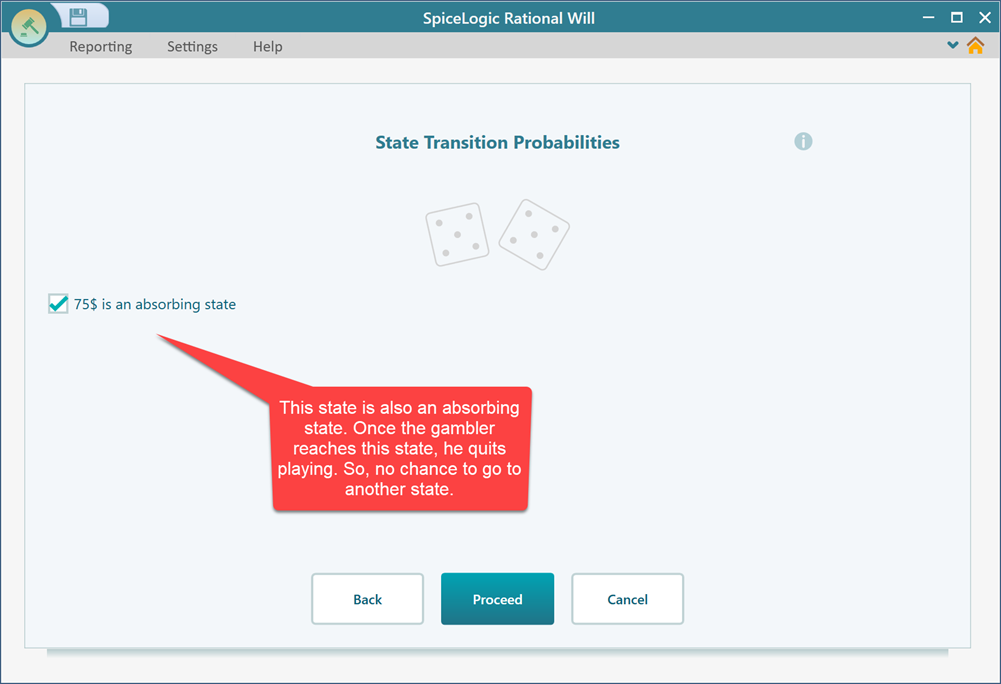
Now the wizard shows you one state at a time and asks where the gambler can go from there on the next spin. This is the heart of the model. Think it through state by state. From $25, a win takes him to $50 and a loss takes him to $0, each with a 50% chance. From $50, a win takes him to $75 and a loss takes him to $25. The two end states, $0 and $75, are where he stops, so they stay put. $0 leads to $0, and $75 leads to $75.
Enter the probabilities for each state as shown below, and click "Proceed" after you finish each one. Here is a quick check you can use as you go. The numbers leaving any single state should add up to 100%. If they do not, you missed a path or typed a wrong value.
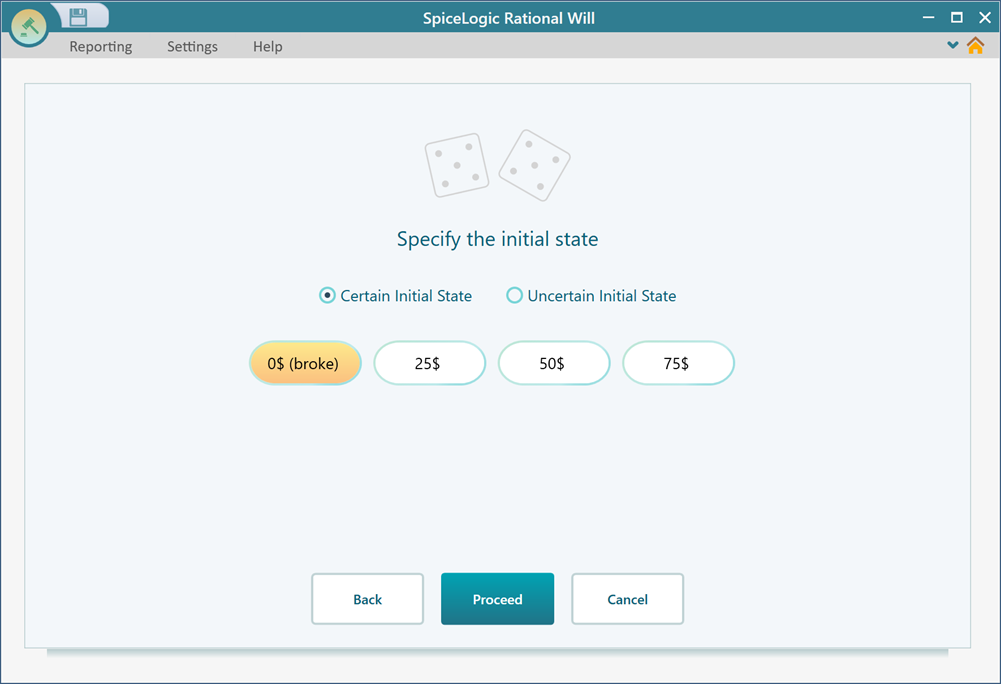
Step 4: Pick the starting state
After the last state, the wizard asks which state the chain should start in. Choose $0 for now and click Proceed. Don't worry about this choice too much. It is easy to change later once the model is built. In fact we will switch it around in a moment to compare different starting amounts.
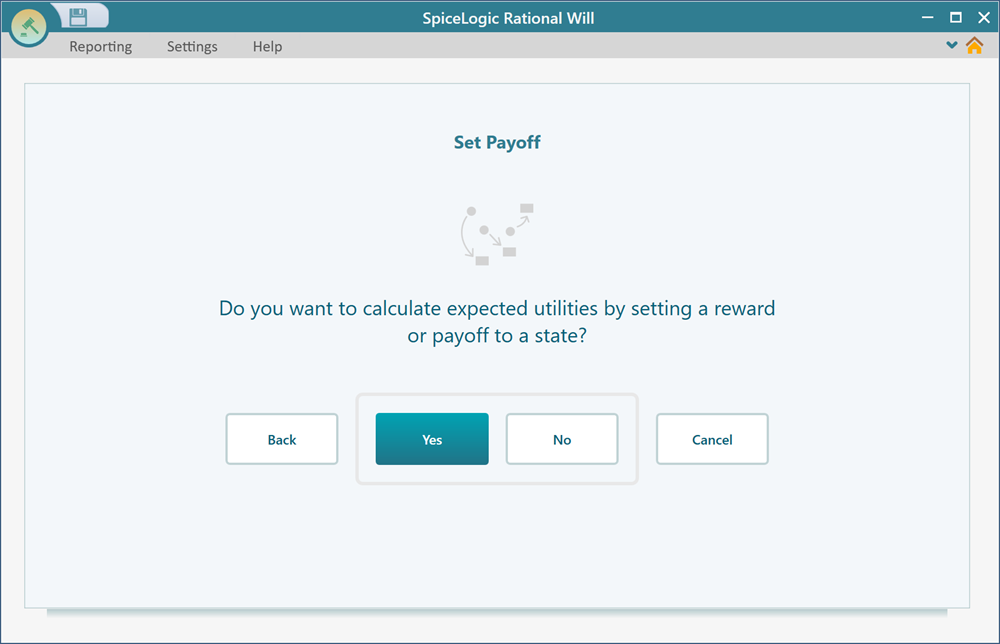
Next the wizard asks whether you want to give any state a reward or payoff. Rewards are handy when you want to add up a value over time. In a medical model that might be cost, or quality of life, counted up cycle by cycle. We don't need any of that here. We only care about which state the gambler lands in, not a running total, so answer "No".
Step 5: Read the result
As soon as you answer "No", the wizard finishes and draws your Markov model as a Decision Tree diagram. Every state and every branch you set up is now laid out in front of you, so you can see the whole process at once and check that it matches what you intended.
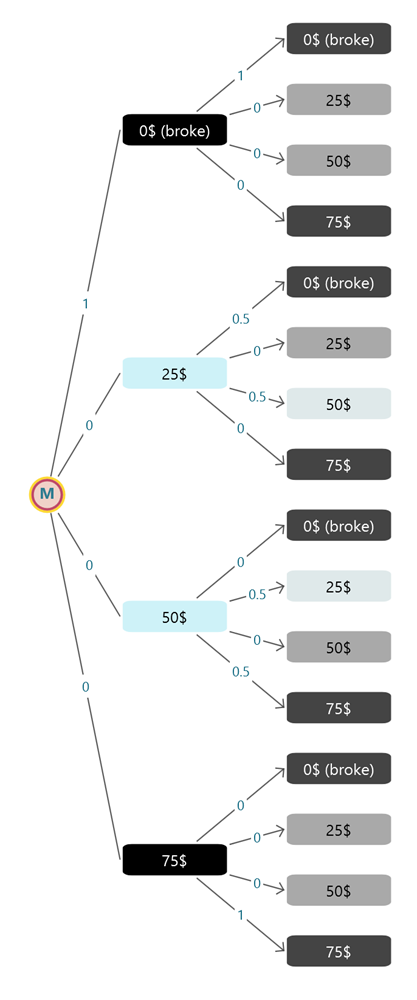
Now you can ask the real question. Where is the gambler most likely to end up, and how much does his starting amount change that? Let's set his starting point to the $50 state, since $50 is what he walked in with. Then we will read the odds, and after that try a different starting amount to see how the answer moves.
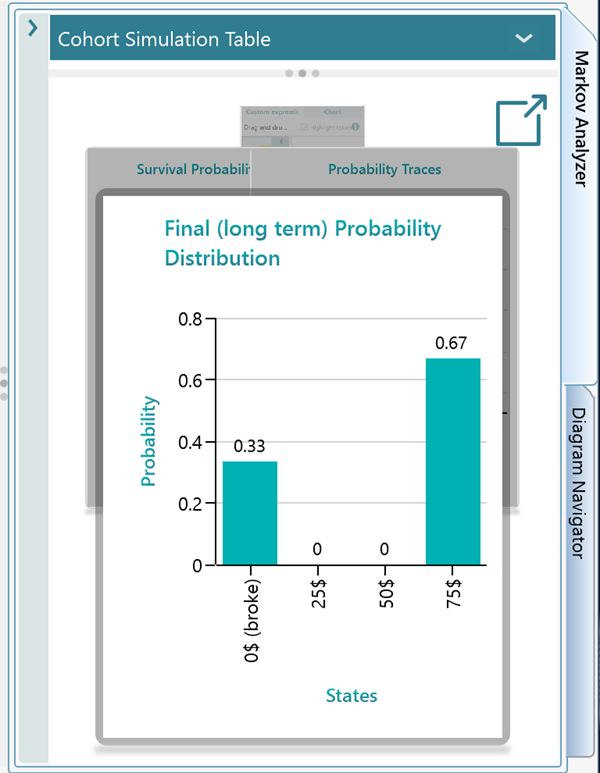
Open the Markov Analyzer panel. Starting from $50, the chance of going broke is 33% and the chance of reaching $75 is 67%. So even in a fair 50/50 game, his odds of cashing out ahead are better than even. The reason is simple. $75 is closer to where he starts than $0 is, so he hits the $75 target more often before he can lose everything.
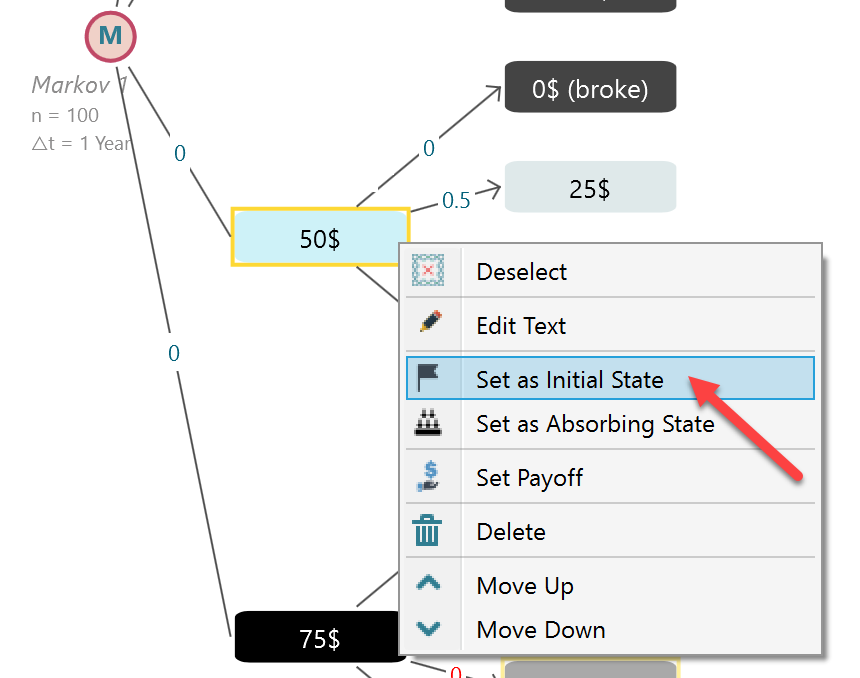
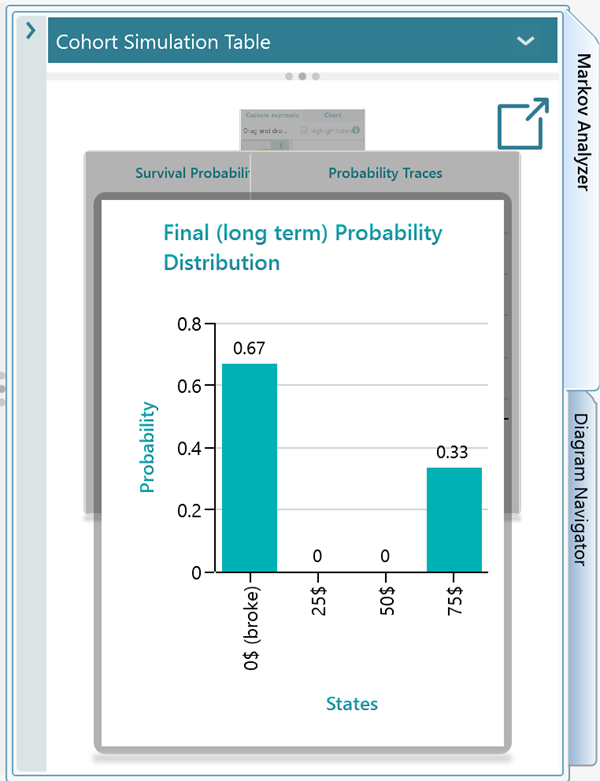
Now let's change the starting point and watch the numbers flip. Select the $25 state and set it as the initial state, the same way you did for $50. Right-click it and choose the option from the menu. Now the chance of going broke jumps to 67% and the chance of reaching $75 drops to 33%. The lesson is plain. The closer he starts to $0, the more likely he is to lose it all, even though every single spin is still a fair coin flip.
Step 6: Change or refine the model
Once the wizard has walked you through every step, you end up with a Decision Tree that shows the full Markov Process. From here you are free to adjust anything. You can rename the states, edit the transition probabilities, add rewards, and so on. To learn how to edit the diagram directly, see this page.