Minimax Regret Analysis
We have already shown how to model uncertainty in the Rational Will Decision Matrix, and how to capture global events and build a decision matrix. On this page we build a decision matrix for a different purpose: Minimax Regret analysis.
What is the Minimax Regret criterion?
Regret is easy to understand. Once you know what actually happened, regret is the gap between the outcome you got and the best outcome you could have had in that same situation. Say you picked option A, the future played out one way, and option B would have done better. That difference is your regret.
The Minimax Regret criterion looks at every choice you could make. For each one, it finds the worst regret that choice could leave you with. Then it picks the choice whose worst case is the smallest. In plain words, it protects you from the decision you would kick yourself over the most.
People reach for it when they cannot put solid numbers on the future and they mostly want to avoid a painful "I should have done the other thing" moment. Think of a small shop owner deciding how much stock to buy before a holiday. They cannot really predict the crowd, but they do not want to be the one staring at empty shelves on the busiest day. Minimax Regret fits that kind of thinking.
Let's work through the same decision we used in the tutorial on how to capture global events and create a decision matrix: "Take the job offer in hand" or "Go to school".
Here is a quick recap. You have a job offer that pays 90K a year. You are ambitious, and you believe that if you go to school and finish a diploma, you can land a better job that pays 120K a year. At the same time, you are worried that a recession might hit and leave you out of work for a long stretch. You put the chance of a recession at 50%.
Your alternatives are:
1. Go to school and complete the diploma.
2. Take the job offer in hand.
Your uncertainties are:
1. The recession comes.
2. The recession does not come.
Your objective is:
To maximize salary.
Start a new Decision Matrix and create an objective called "Maximize Salary" as a Number type. We covered how to set up an objective in the Getting Started with the Decision Matrix tutorial.
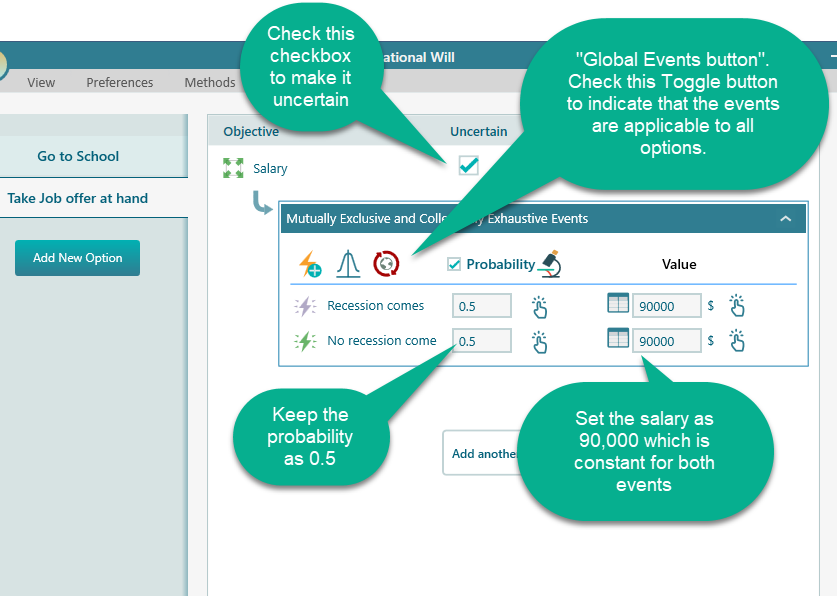
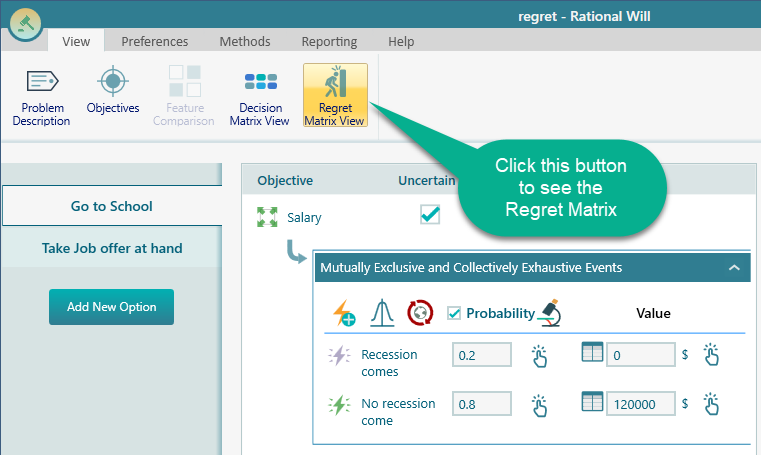
Now model the option "Take job offer at hand" as shown below. Notice the Global Event button. Click that button to make the events global, which means they apply to all of your options.
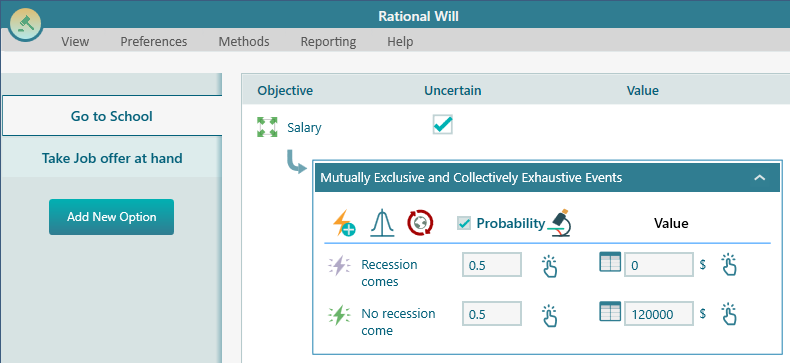
Now select the option "Go to School". You will see that the same global events are already there for this option too, because you turned on the Global Event button earlier. That is the whole point of global events. The recession either happens or it does not, and it happens the same way no matter which choice you make. So both options share the exact same events.
This matters for a regret analysis. To compare regret fairly, each option has to be judged against the same future. If "Go to School" had its own private recession that was somehow different from the "Take the job" recession, the numbers would not line up and the comparison would be meaningless. Global events keep the playing field the same for every option.
Model the "Go to School" option as shown below.
That is it for the setup. The situation is fully modeled, so let's look at the result.
Minimax Regret analysis
Up to now, the result has been worked out using the Maximize Expected Utility criterion. That method weighs each outcome by how likely it is, so the 50% chance of a recession is baked into the score.
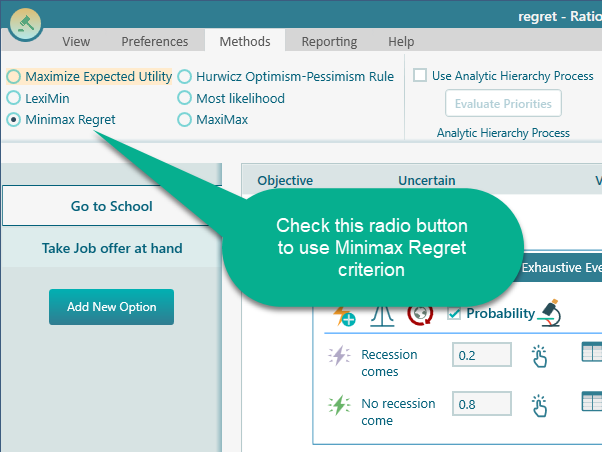
For this analysis we want a different lens. We are not asking "what is the best bet on average?" We are asking "which choice keeps my worst regret as small as possible?" That is the Minimax Regret view, so we switch the criterion over.
On the ribbon, open the Methods tab and select the Minimax Regret radio button. The result updates right away to reflect the new criterion.
As soon as you do that, the Maximum Regret chart appears in the Result section. This chart shows one bar per option, and each bar is the largest regret that option could leave you with.
Reading it is simple. The option with the shortest bar is the safe pick under this criterion, because its worst case is the least painful. A long bar is a warning. It means that if things break the wrong way for that choice, the regret could be heavy. So you scan for the shortest bar and that is your answer.
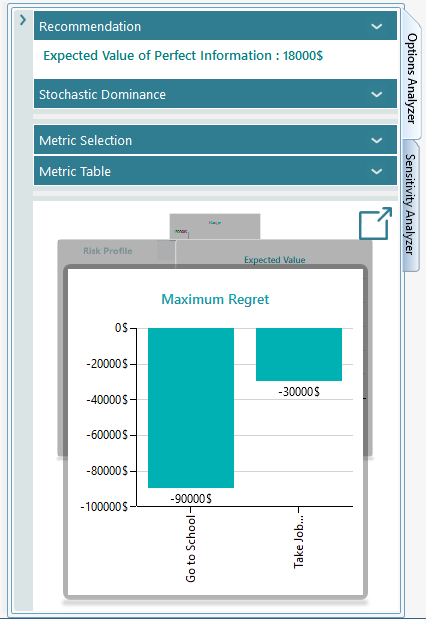
Let's read the chart. If you go to school and a recession comes, your worst case is a $90,000 opportunity loss. You gave up the 90K job for a year, the better job never showed up, and you are left with nothing. That is the heaviest regret on the board.
Taking the job is not regret-free either. If you take the job and the recession does not come, you find out later that school would have led to the 120K job, so you missed out by $30,000. That is your worst case for the job option, and it is much smaller than the $90,000 you could regret on the school side.
So the comparison is clear. The worst regret for going to school is $90,000, and the worst regret for taking the job is $30,000. Minimax Regret tells you to pick the option with the smaller worst case, which is taking the job offer in hand. By this criterion, taking the job is the right move because it keeps your maximum possible regret as low as it can be.
Notice that this is a careful, defensive way to choose. It does not promise the biggest payoff. It promises that whatever happens, you will not be hit with the worst possible regret. If you are the type who would lose sleep over a bad-luck outcome, this is the criterion that speaks your language.
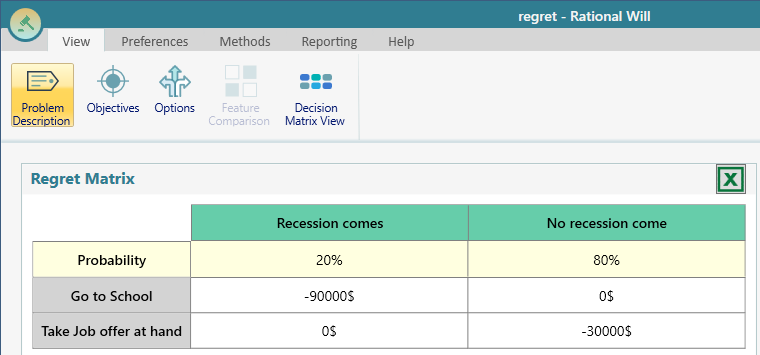
Viewing the Regret Matrix
You may also want to see the full Regret Matrix. It lays out the regret for every option against every event, so you can check the numbers behind the chart instead of trusting the bars alone. On the ribbon, open the View tab and click the "Regret Matrix View" button.
Once you click that button, the Regret Matrix appears, as shown below. Each row is one of your options and each column is one of the events. So every cell tells you the regret you would feel for that exact combination, for example "Go to School" when "the recession comes".
Here is how to read it at a glance. Look across a single row and find the biggest number. That number is that option's worst case. Do the same for each row, and those worst-case numbers are exactly what the Maximum Regret chart compares. So a zero in a cell means that option was the best possible choice for that event, and you would have no regret there at all. The matrix is just the full picture behind the chart, with nothing hidden.