Consistency ratio and Transitivity Rule

    The consistency ratio shows how consistent your pairwise comparisons are. A simple example makes the idea easier to see. Suppose you prefer an apple twice as much as an orange.

    Illustration for the AHP consistency example: an apple paired with an orange to show a preference of 'apple twice as much as orange'.
    Illustration for the AHP consistency example: an apple paired with an orange to show a preference of 'apple twice as much as orange'.

    Now suppose you prefer an orange 3 times as much as a banana.

    Illustration for the AHP consistency example: an orange paired with a banana to show a preference of 'orange three times as much as banana'.
    Illustration for the AHP consistency example: an orange paired with a banana to show a preference of 'orange three times as much as banana'.

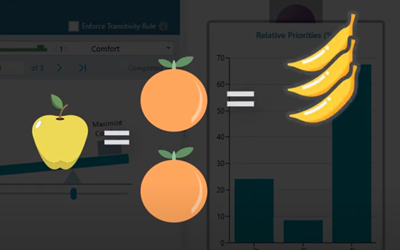
    If those two judgments are consistent, you should prefer an apple 6 times as much as a banana.

    Illustration for the AHP consistency example: apple, orange, and banana shown together to derive the implied consistent preference of apple six times as much as banana.
    Illustration for the AHP consistency example: apple, orange, and banana shown together to derive the implied consistent preference of apple six times as much as banana.
    Illustration for the AHP consistency example: an apple paired with a banana, used to test whether the user's direct judgment matches the consistent value of 6 implied by the previous two comparisons.
    Illustration for the AHP consistency example: an apple paired with a banana, used to test whether the user's direct judgment matches the consistent value of 6 implied by the previous two comparisons.

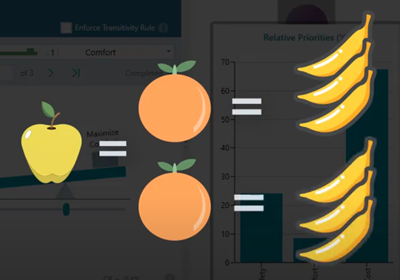
    If you are then asked to compare apple and banana, but you do not choose a 6:1 preference, your judgments contain some inconsistency.

    The consistency ratio measures that inconsistency. When your judgments are perfectly consistent, the consistency ratio is 0. As the judgments move farther away from perfect consistency, the number increases.

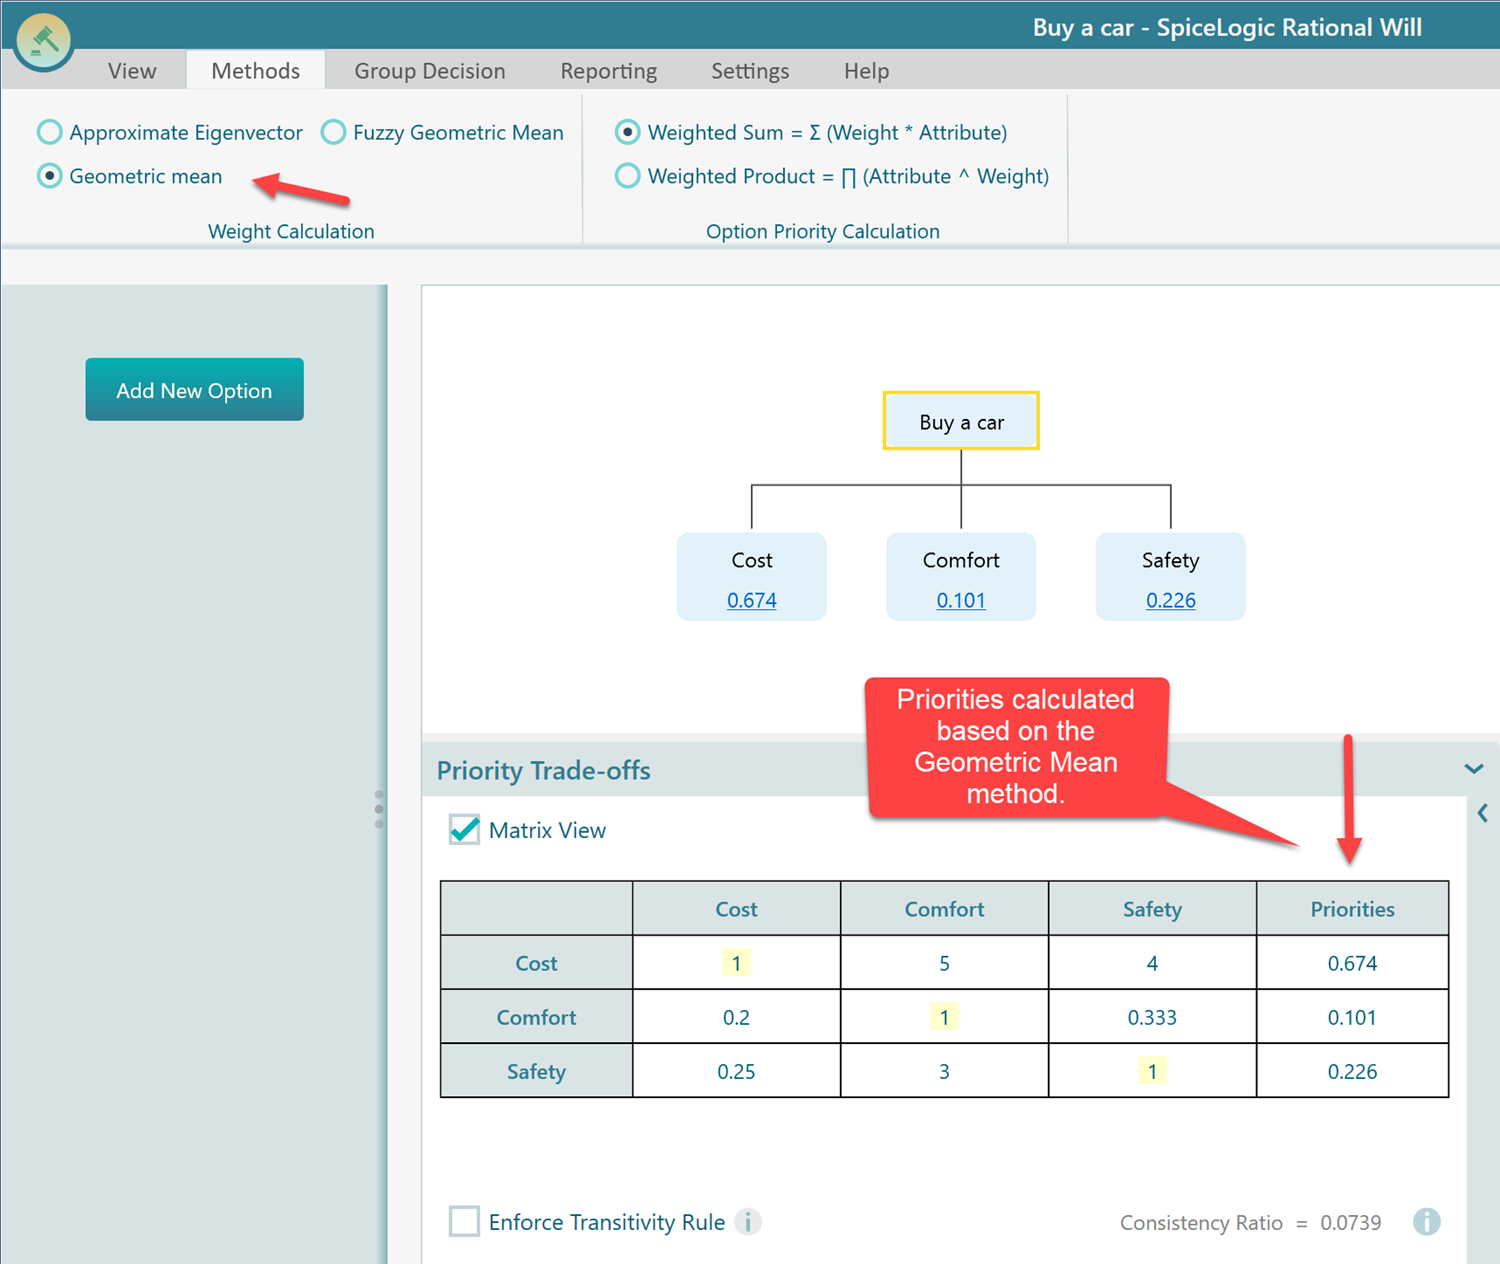
    In SpiceLogic AHP Software, the consistency ratio appears whenever you perform pairwise comparisons or view the pairwise comparison matrix. It is shown at the bottom of the comparison panel.

    AHP Software pairwise comparison panel for Safety vs Comfort with a red arrow pointing at 'Consistency Ratio = 0.0061' displayed under the slider, recalculated automatically whenever the user changes a judgment.
    AHP Software pairwise comparison panel for Safety vs Comfort with a red arrow pointing at 'Consistency Ratio = 0.0061' displayed under the slider, recalculated automatically whenever the user changes a judgment.

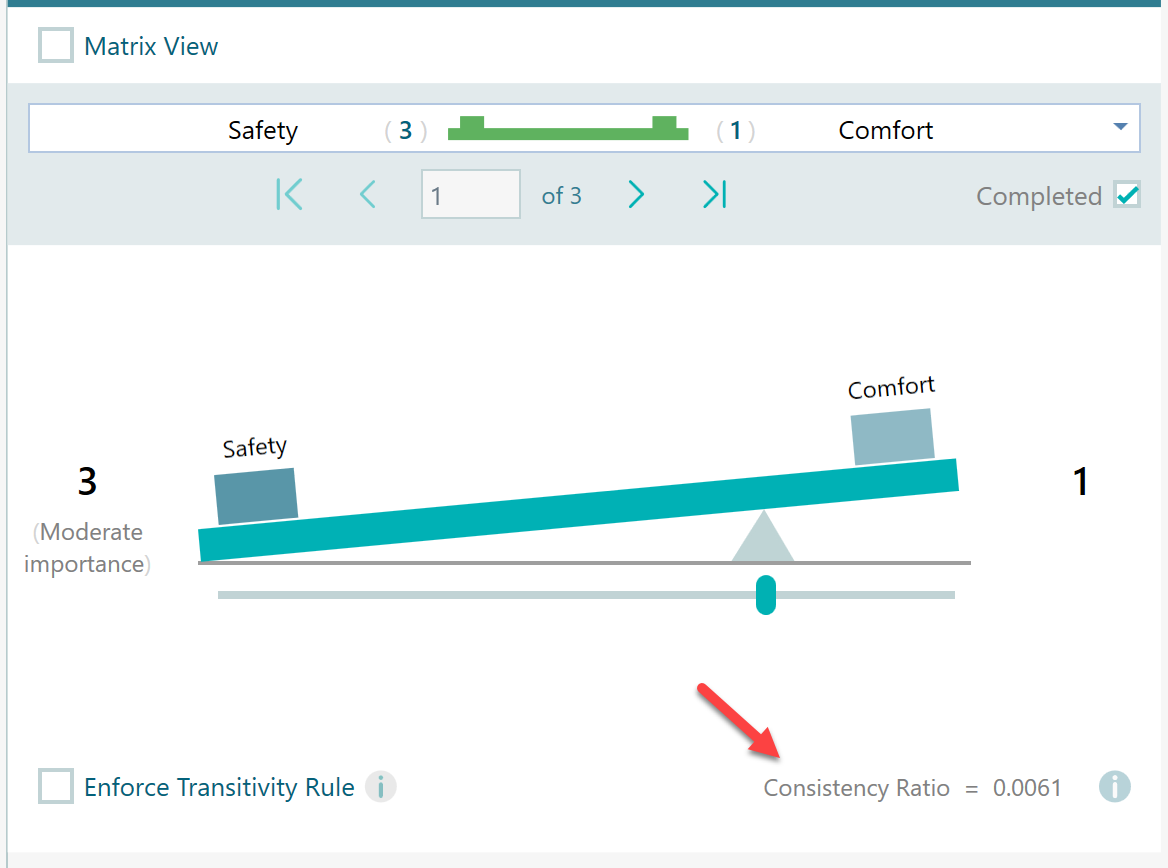
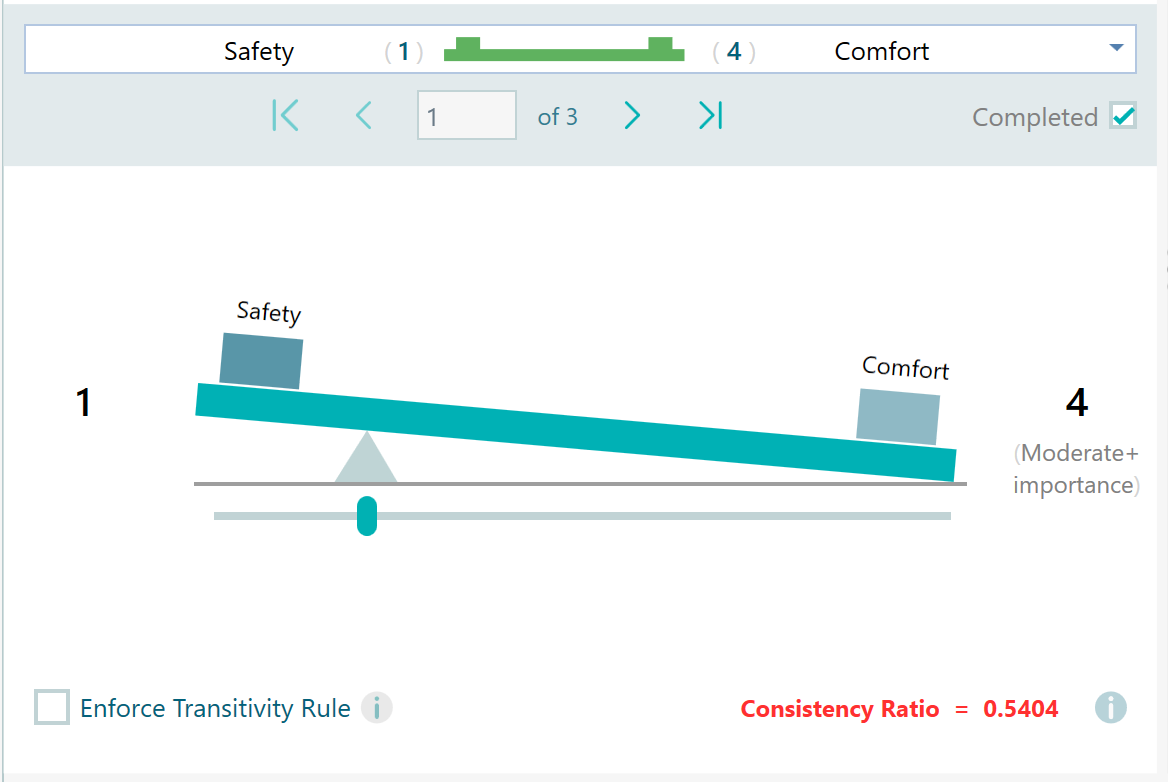
    Thomas L. Saaty suggested that the consistency ratio should usually be less than or equal to 0.1. If the value is above 0.1, you should review the judgments and see whether some comparisons need to be revised. When the consistency ratio goes above 0.1, the software highlights it in red so it is easy to notice.

    AHP Software flagging a Consistency Ratio above 0.10 (10 percent) in bold red text, the Saaty threshold above which the user is advised to revise their pairwise judgments.
    AHP Software flagging a Consistency Ratio above 0.10 (10 percent) in bold red text, the Saaty threshold above which the user is advised to revise their pairwise judgments.

    Calculation Method

    The page about AHP calculation methods explains how pairwise comparison priorities are calculated.

    After the priority vector is calculated, the consistency calculation uses the principal eigenvalue from the pairwise comparison matrix. From that value, we calculate the Consistency Index. Then we divide the Consistency Index by the Random Index to get the Consistency Ratio.

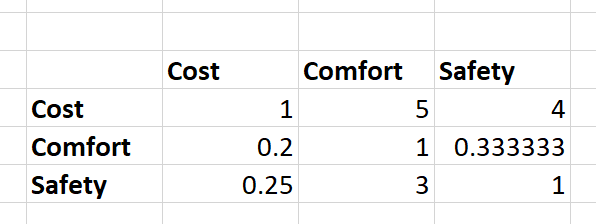
    Suppose we have the pairwise comparison matrix shown below.

    Original pairwise comparison matrix used in the worked Consistency Ratio example, with reciprocal cell values for Cost, Comfort, and Safety.
    Original pairwise comparison matrix used in the worked Consistency Ratio example, with reciprocal cell values for Cost, Comfort, and Safety.

    Using the geometric mean method, we get the following priority vector.

    AHP Software with the Geometric mean method selected (red arrow) producing the priority vector (Cost 0.674, Comfort 0.101, Safety 0.226) in the Matrix View, the input used to compute the principal eigenvalue for the Consistency Ratio example.
    AHP Software with the Geometric mean method selected (red arrow) producing the priority vector (Cost 0.674, Comfort 0.101, Safety 0.226) in the Matrix View, the input used to compute the principal eigenvalue for the Consistency Ratio example.

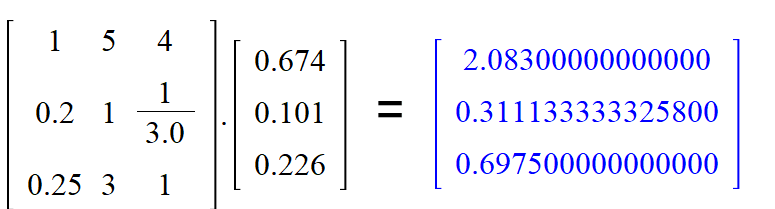
    To get the principal eigenvalue, we multiply the pairwise comparison matrix by the priority vector.

    Matrix multiplication of the pairwise comparison matrix by the priority vector, the intermediate step toward calculating the principal eigenvalue.
    Matrix multiplication of the pairwise comparison matrix by the priority vector, the intermediate step toward calculating the principal eigenvalue.

    Next, divide each value in the multiplication result by the matching value in the priority vector. This gives a small vector of eigenvalue estimates.

    Eigenvector derived by element-wise division of the matrix-multiplication result vector by the priority vector, used to average into the principal eigenvalue.
    Eigenvector derived by element-wise division of the matrix-multiplication result vector by the priority vector, used to average into the principal eigenvalue.

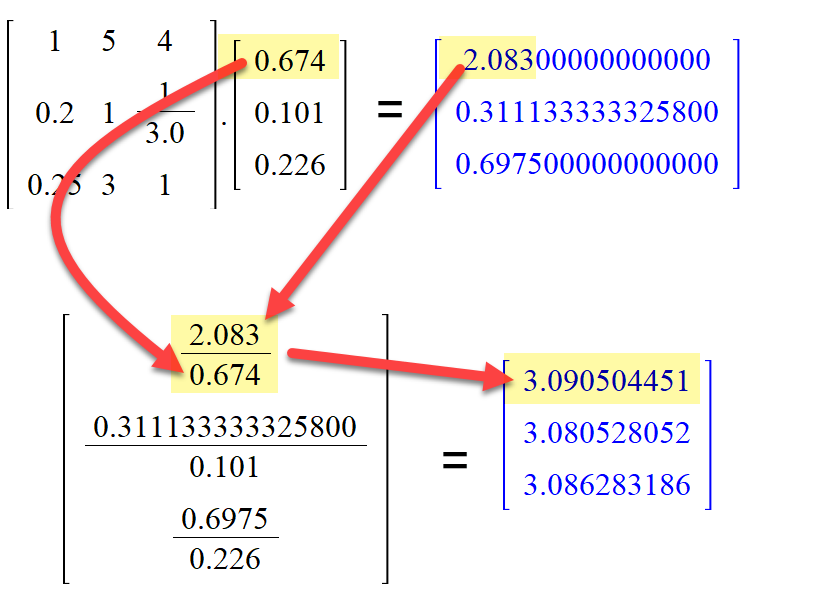
    The principal eigenvalue is the average of those values: (3.090504451 + 3.080528052 + 3.086283186) / 3 = 3.085771896.

    The next step is to calculate the Consistency Index.

    Consistency Index formula CI = (lambda_max - n) / (n - 1) where lambda_max is the principal eigenvalue and n is the number of items being compared.
    Consistency Index formula CI = (lambda_max - n) / (n - 1) where lambda_max is the principal eigenvalue and n is the number of items being compared.

    Here, n = 3 and the principal eigenvalue is 3.085771896. So the Consistency Index is 0.042885948.

    Now we compare this value with the Random Index. The Random Index represents the expected inconsistency from a randomly filled pairwise comparison matrix of the same size. Saaty provided Random Index values for matrices with different numbers of items.

    Saaty's published Random Index reference table giving the consistency index of a randomly generated matrix as a function of matrix size n, used as the denominator of the Consistency Ratio.
    Saaty's published Random Index reference table giving the consistency index of a randomly generated matrix as a function of matrix size n, used as the denominator of the Consistency Ratio.

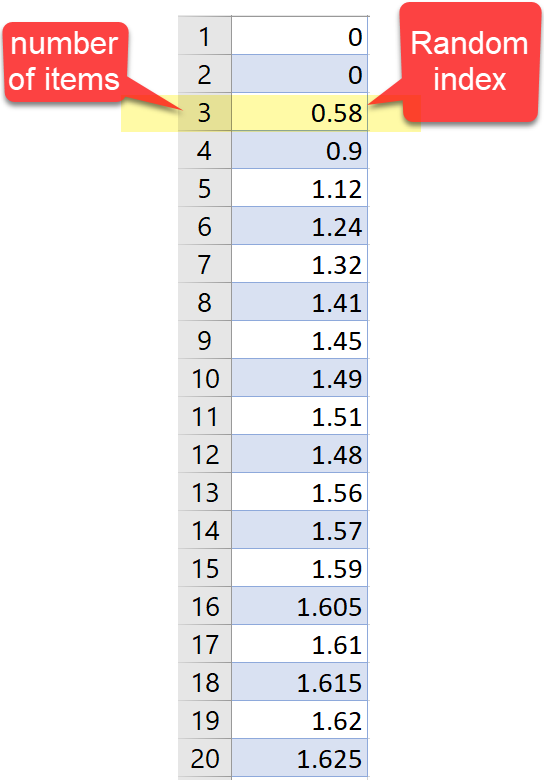
    In this example, the matrix has 3 items, so the Random Index is 0.58.

    We already calculated the Consistency Index as 0.042885948.

    Consistency Ratio = Consistency Index / Random Index.

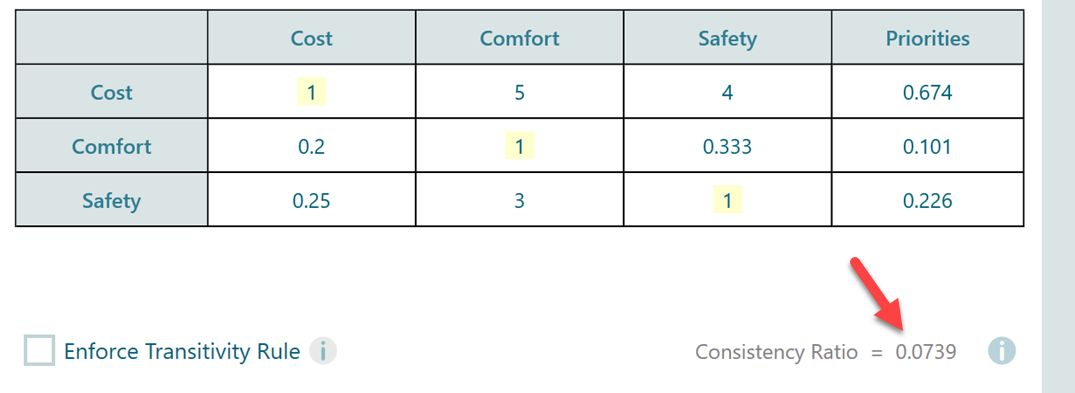
    = 0.042885948 / 0.58 = 0.0739.

    This matches the Consistency Ratio shown in SpiceLogic AHP Software.

    AHP Software displaying the Consistency Ratio as 0.0739 for the worked example, matching the result obtained by hand calculation (CI 0.043 divided by Random Index 0.58).
    AHP Software displaying the Consistency Ratio as 0.0739 for the worked example, matching the result obtained by hand calculation (CI 0.043 divided by Random Index 0.58).

    Transitivity Rule

    The transitivity rule is another way to enforce consistency. If you say an apple is 2 times preferred to an orange, and an orange is 3 times preferred to a banana, then a fully transitive model implies that an apple is 6 times preferred to a banana.

    Human judgment does not always follow that pattern. A person may choose 4 or 5 instead of 6 when directly comparing apple and banana. That is why AHP normally asks for the apple-vs-banana comparison as well.

    If you enforce transitivity, the missing comparison can be inferred from the earlier comparisons. This can reduce the number of pairwise comparisons. Without transitivity, the number of comparisons is 1/2 * n * (n - 1). With transitivity enforced, it can be reduced to n - 1.

    That can save a lot of time when your AHP model has many criteria or subcriteria. SpiceLogic AHP Software can enforce the transitivity rule, as shown below.

    AHP Software pairwise comparison panel before the Transitivity Rule is enforced, showing 10 independent pairwise comparisons that the user must complete.
    AHP Software pairwise comparison panel before the Transitivity Rule is enforced, showing 10 independent pairwise comparisons that the user must complete.

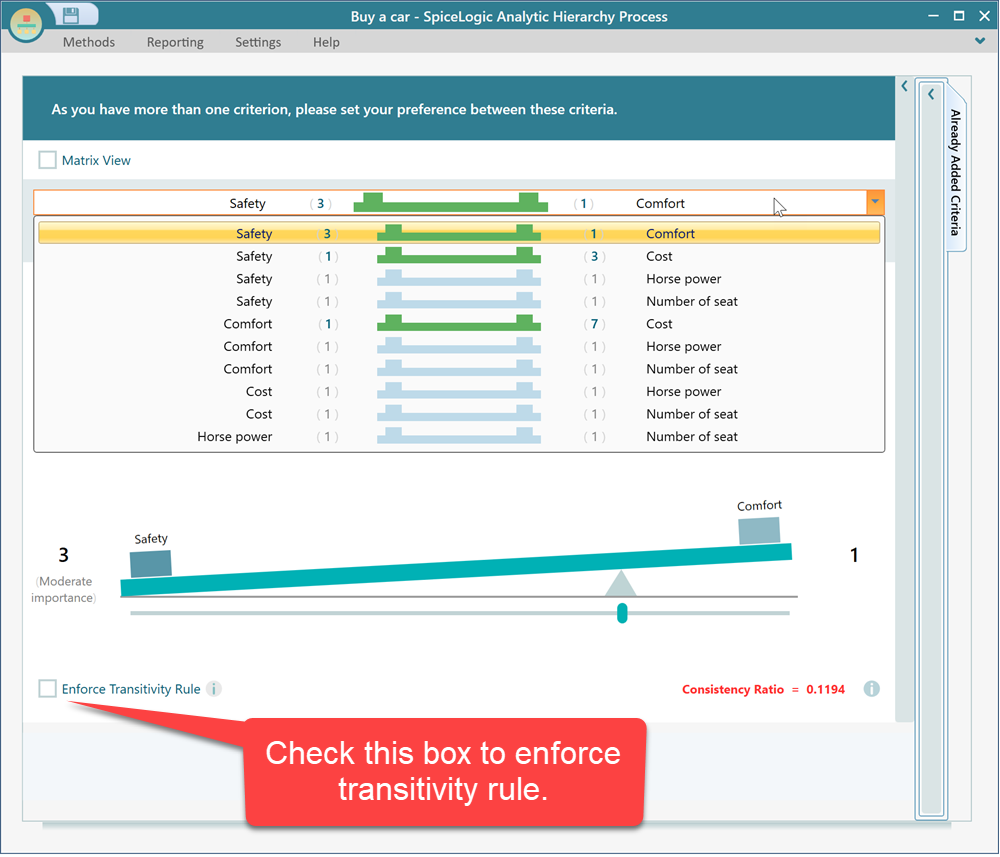
    Before applying the transitivity rule, the example above requires 10 pairwise comparisons.

    After checking the transitivity-rule checkbox, the number of comparisons is reduced to 4.

    AHP Software pairwise comparison panel after the Transitivity Rule checkbox is ticked: the number of required comparisons drops from 10 to 4 because the remaining values are derived automatically.
    AHP Software pairwise comparison panel after the Transitivity Rule checkbox is ticked: the number of required comparisons drops from 10 to 4 because the remaining values are derived automatically.

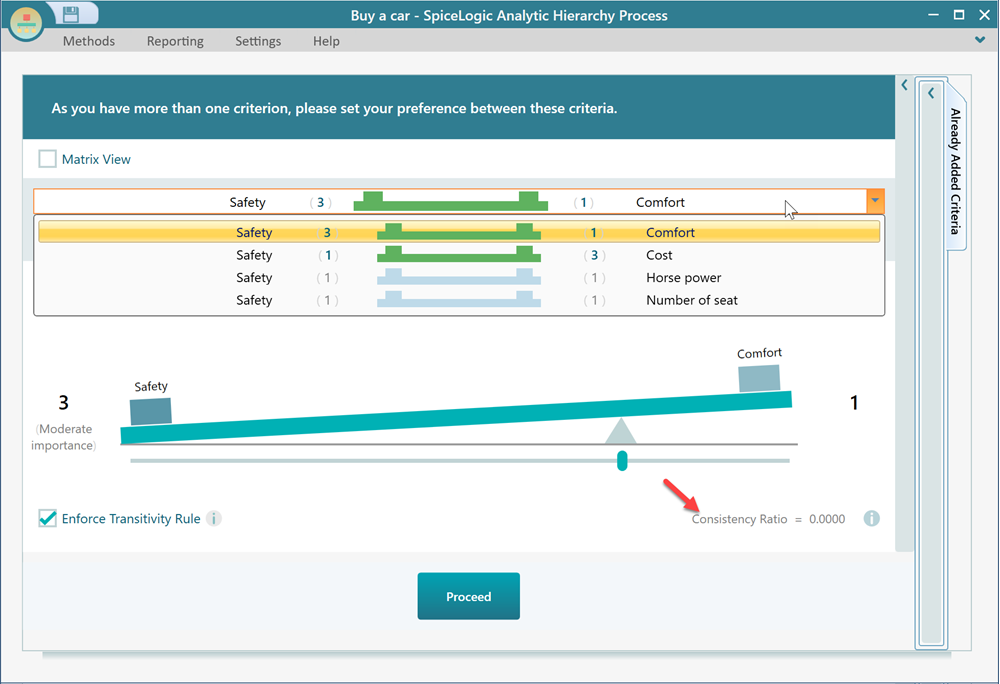
    The consistency ratio is also shown as 0. That is expected because the software is not allowing judgments that violate transitivity.

    Last updated on Feb 10, 2022