Calculation Methods
After you enter pairwise comparisons for criteria or options, AHP Software calculates a relative weight for each factor. Those weights are then used to calculate the final weighted sum or weighted product for each option.
SpiceLogic AHP Software gives you several calculation methods. Most users can safely keep the defaults, but the options are available when you want to compare methods or reproduce a specific academic approach.
Try it live. Run a quick AHP calculation now: enter your criteria, make the pairwise comparisons, and see the priority weights and the consistency ratio instantly.
Open the AHP Calculator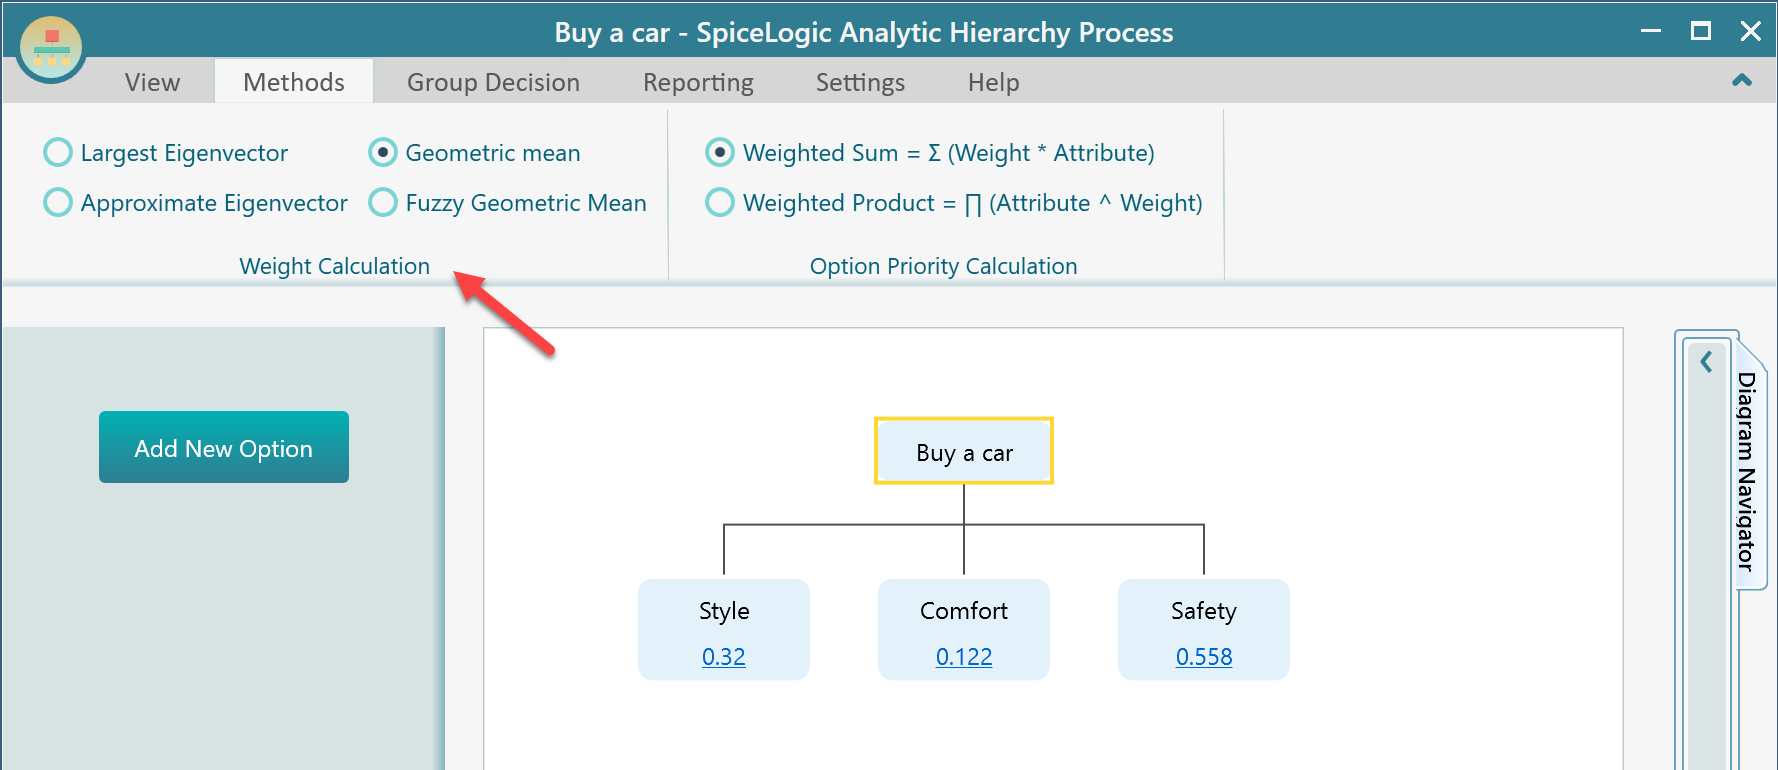
If you are in a hurry and unsure which method to choose, keep the default settings. The default methods are standard and recommended for normal use. The other methods are available for experimentation or for cases where your study requires a specific calculation method.
In practice, these methods usually produce very similar rankings. In rare cases, a different method may change the final recommendation, so it is useful to know what each method does.
Approximate Eigenvector Method
By default, AHP Software uses the Approximate Eigenvector method unless you choose another method.
This method is easy to understand. It provides a useful approximation of the weights, especially when the comparison matrix has low inconsistency.
Step 1: Normalize the Columns
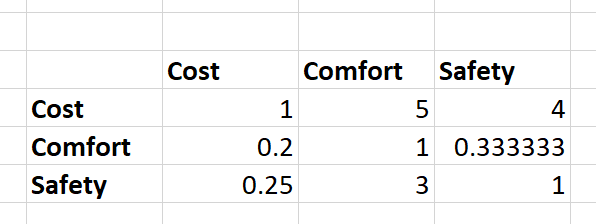
Suppose we have the pairwise comparison matrix below.
Normalize each column so the values in that column add up to 1. First calculate the sum of the column, then divide each cell in that column by the column sum. The following figure shows the process.
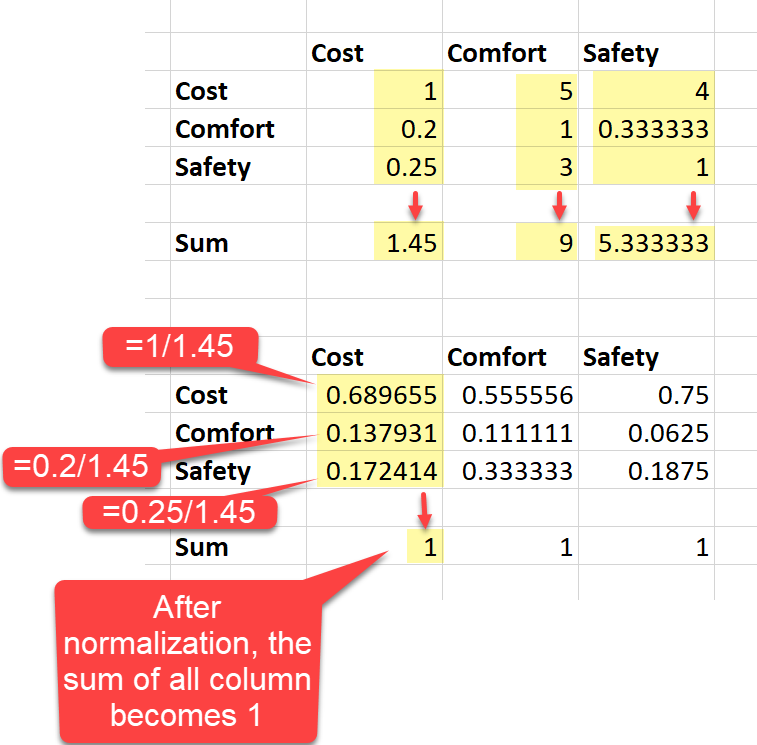
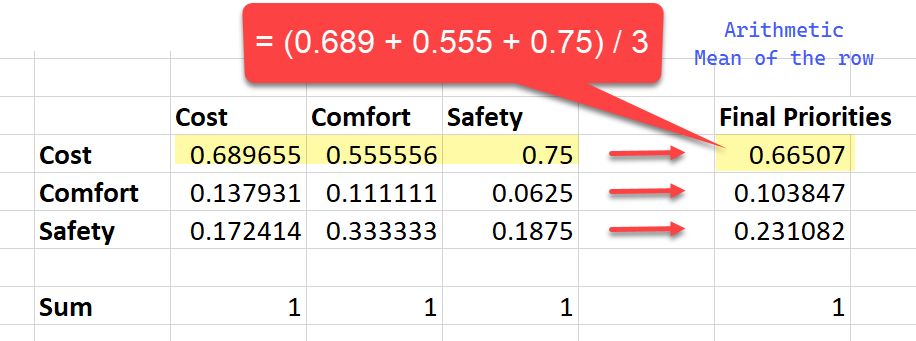
Step 2: Take the Arithmetic Mean of Each Row
After the matrix is normalized, calculate the arithmetic mean of each row. Those row averages become the priority weights.
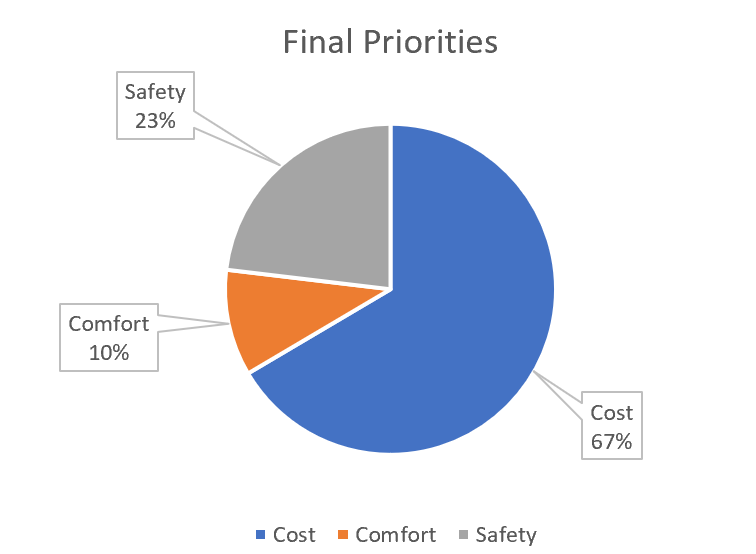
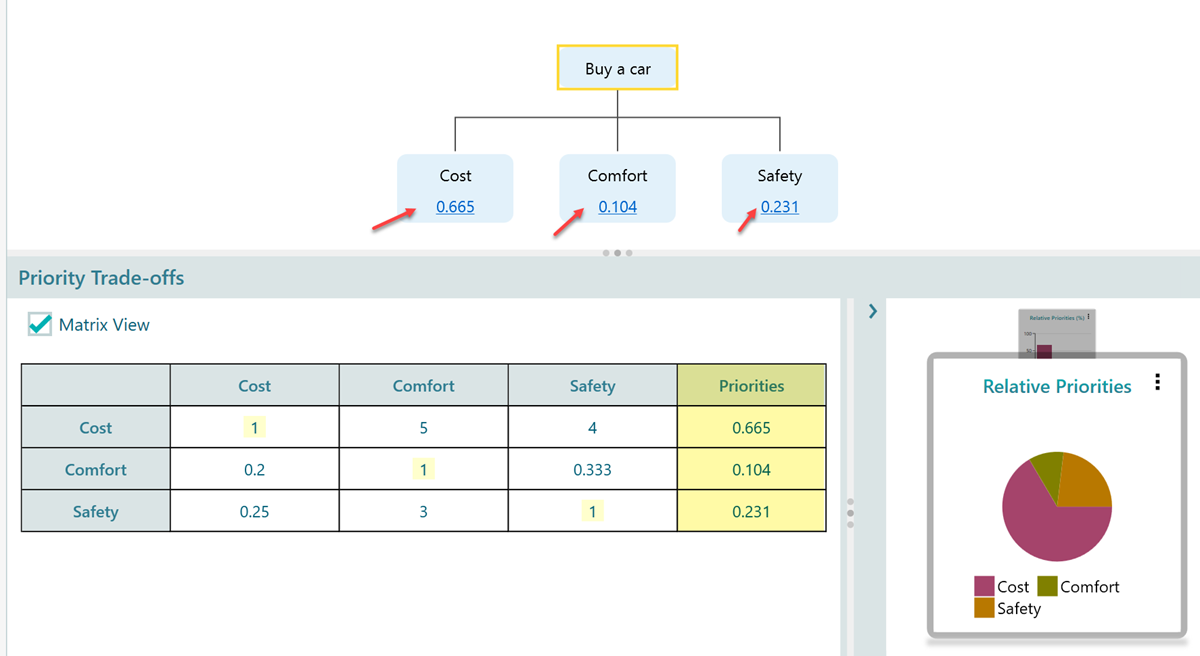
This is how SpiceLogic AHP Software calculates priorities when the Approximate Eigenvector method is selected.
Largest Eigenvector Method
You can learn more about this method from this article: https://medium.com/dlprodteam/the-ahp-pairwise-process-c639eadcbd0e
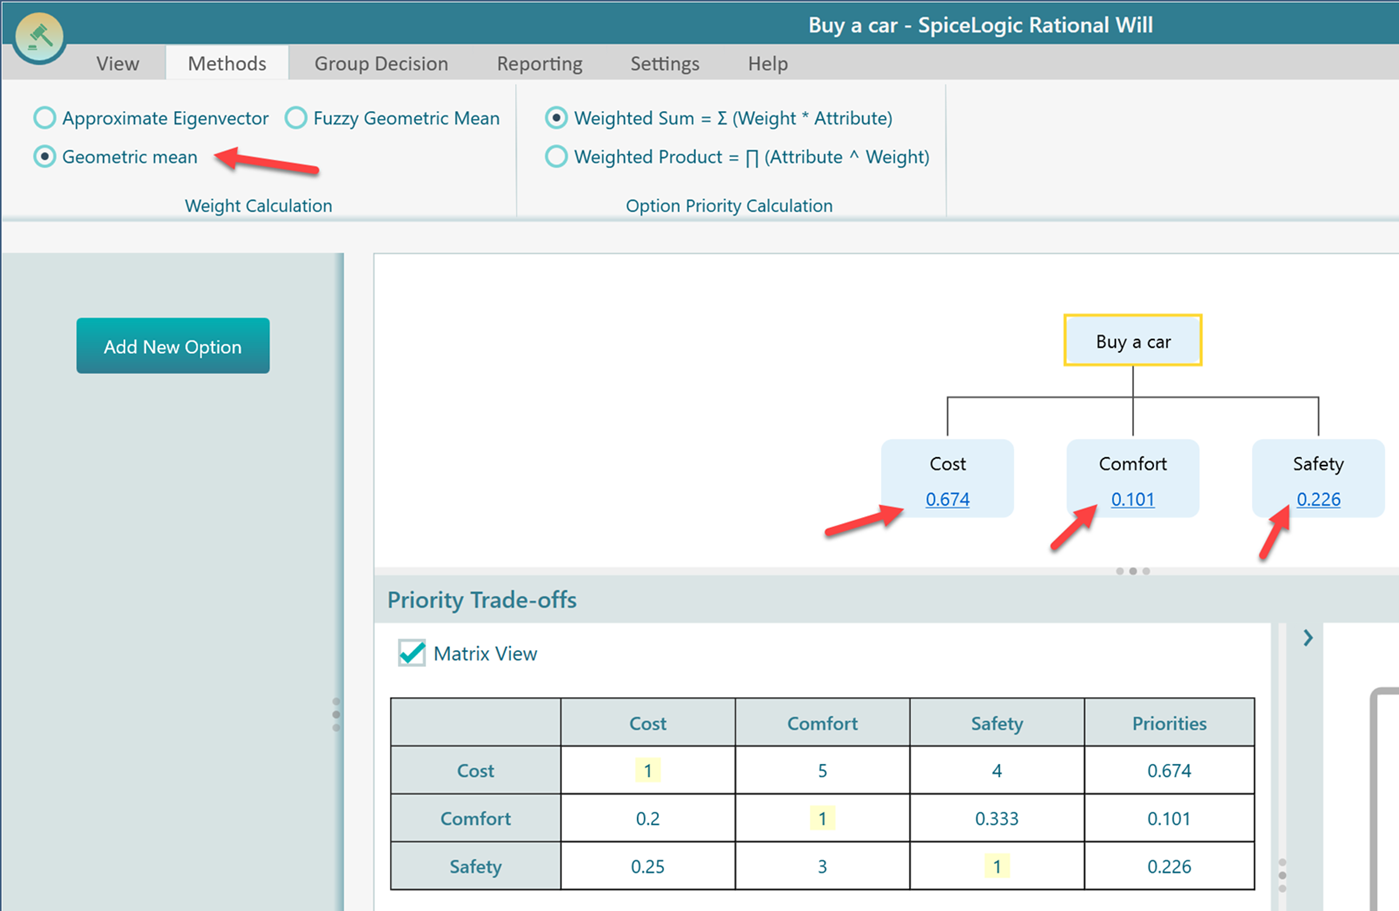
Geometric Mean Method
With the geometric mean method, the software first calculates the geometric mean of each row in the pairwise comparison matrix. That value represents the raw priority for the factor in that row.
Because priority weights should add up to 1, the raw priorities are then normalized. Each raw priority is divided by the sum of all raw priorities. The figure below shows the process.
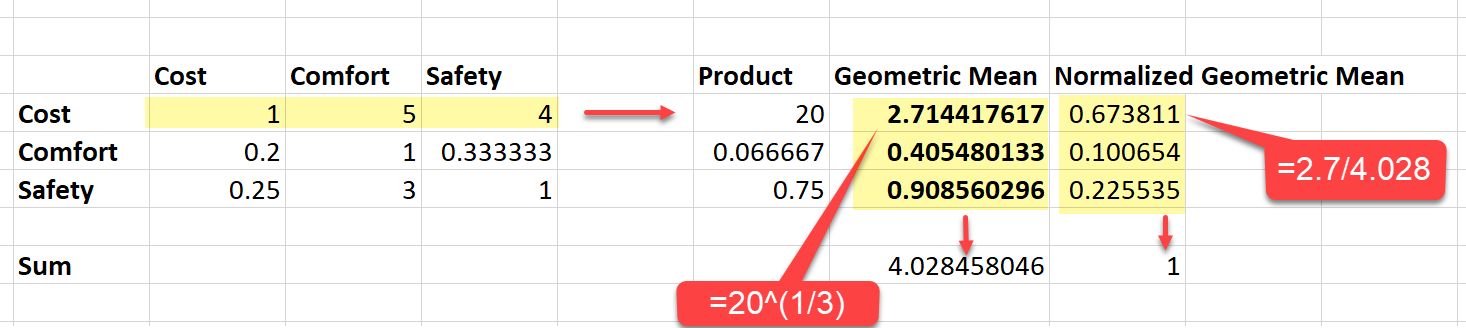
The left side of the figure shows the original pairwise comparison matrix. For the first row, "Cost", multiply the row values: 1 x 5 x 4 = 20. The geometric mean is the third root of 20, written as 20 ^ (1/3.0). In Excel, you can calculate it with the formula shown below.
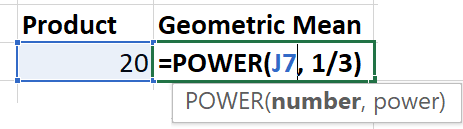
The geometric mean of the Cost row is 20 ^ (1/3.0) = 2.71. In the same way, the geometric means for Comfort and Safety are 0.405 and 0.908.
Next, add the raw priority values: 2.7144 + 0.405 + 0.908 = 4.028. Then divide each raw priority by 4.028. The final normalized priorities are Cost = 0.67, Comfort = 0.10, and Safety = 0.22.
When you choose the geometric mean method in SpiceLogic AHP Software, the diagram and table match this hand calculation.
Fuzzy Geometric Mean Method
For fuzzy AHP, we use the fuzzy geometric mean approach. The following video explains the method we adopted for the software: https://vimeo.com/1201933899
Calculating the Consistency Ratio
Every pairwise comparison panel also shows a "Consistency Ratio". To see how it is calculated, read the dedicated consistency-ratio page.
Calculating the Final Option Value
After the software calculates priorities from a pairwise comparison matrix, it uses those priorities to score the options.
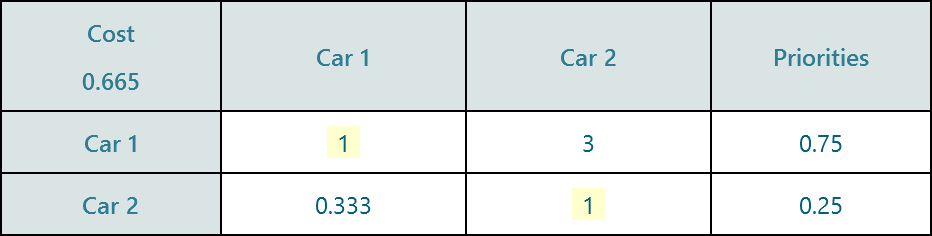
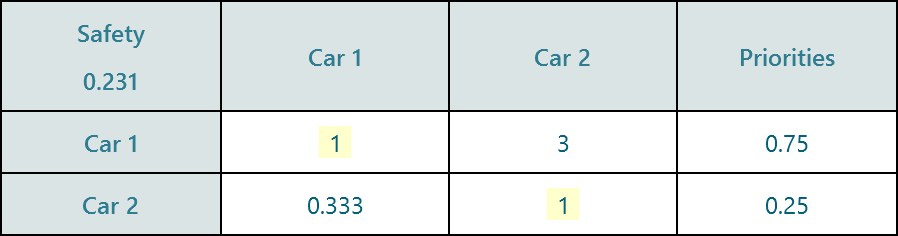
Suppose the relative weight for Cost is 0.665. Also suppose there are two options, "Car 1" and "Car 2". The software compares Car 1 and Car 2 against Cost and produces a priority vector for that criterion.
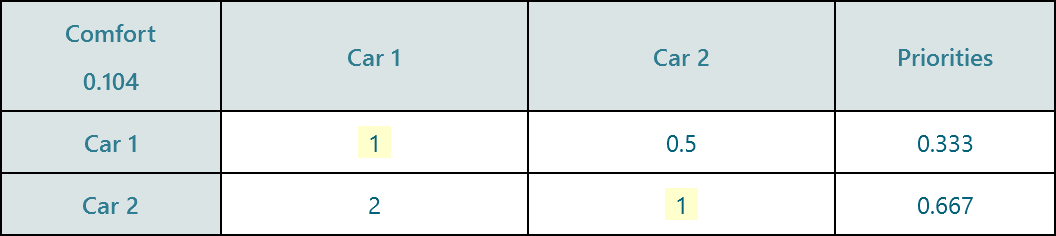
The same process is repeated for each criterion. Each criterion gets its own option-priority vector.
Then the software combines those values with either the Weighted Sum method or the Weighted Product method to calculate the final priority for each option.
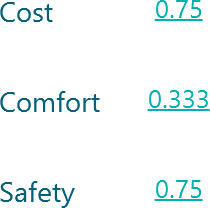
After the pairwise comparisons, suppose the attributes for Car 1 are:
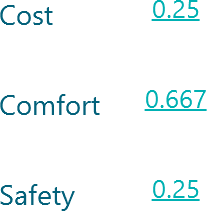
And suppose the attributes for Car 2 are:
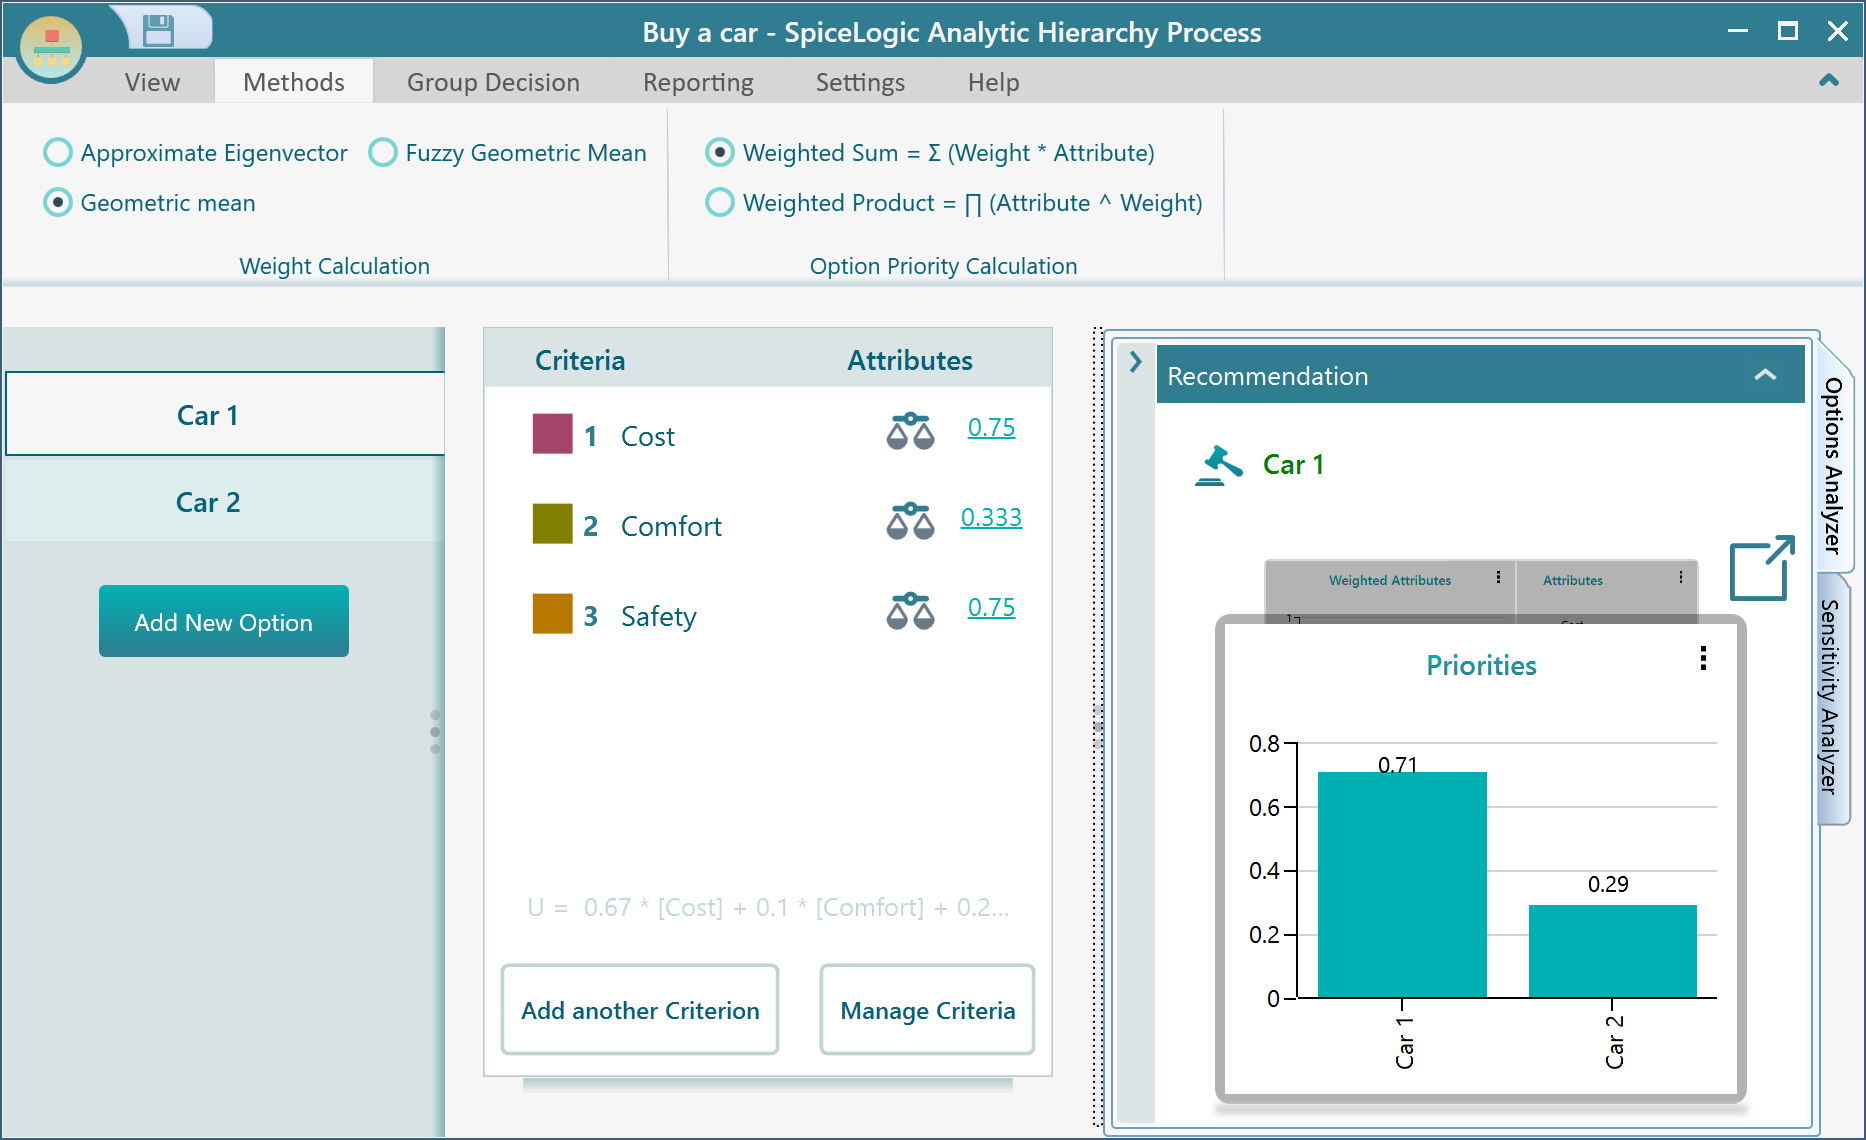
The software now combines the option attributes to calculate the final value. The default method is "Weighted Sum", which is the regular recommended method. "Weighted Product" is also available if you want to experiment or compare methods.
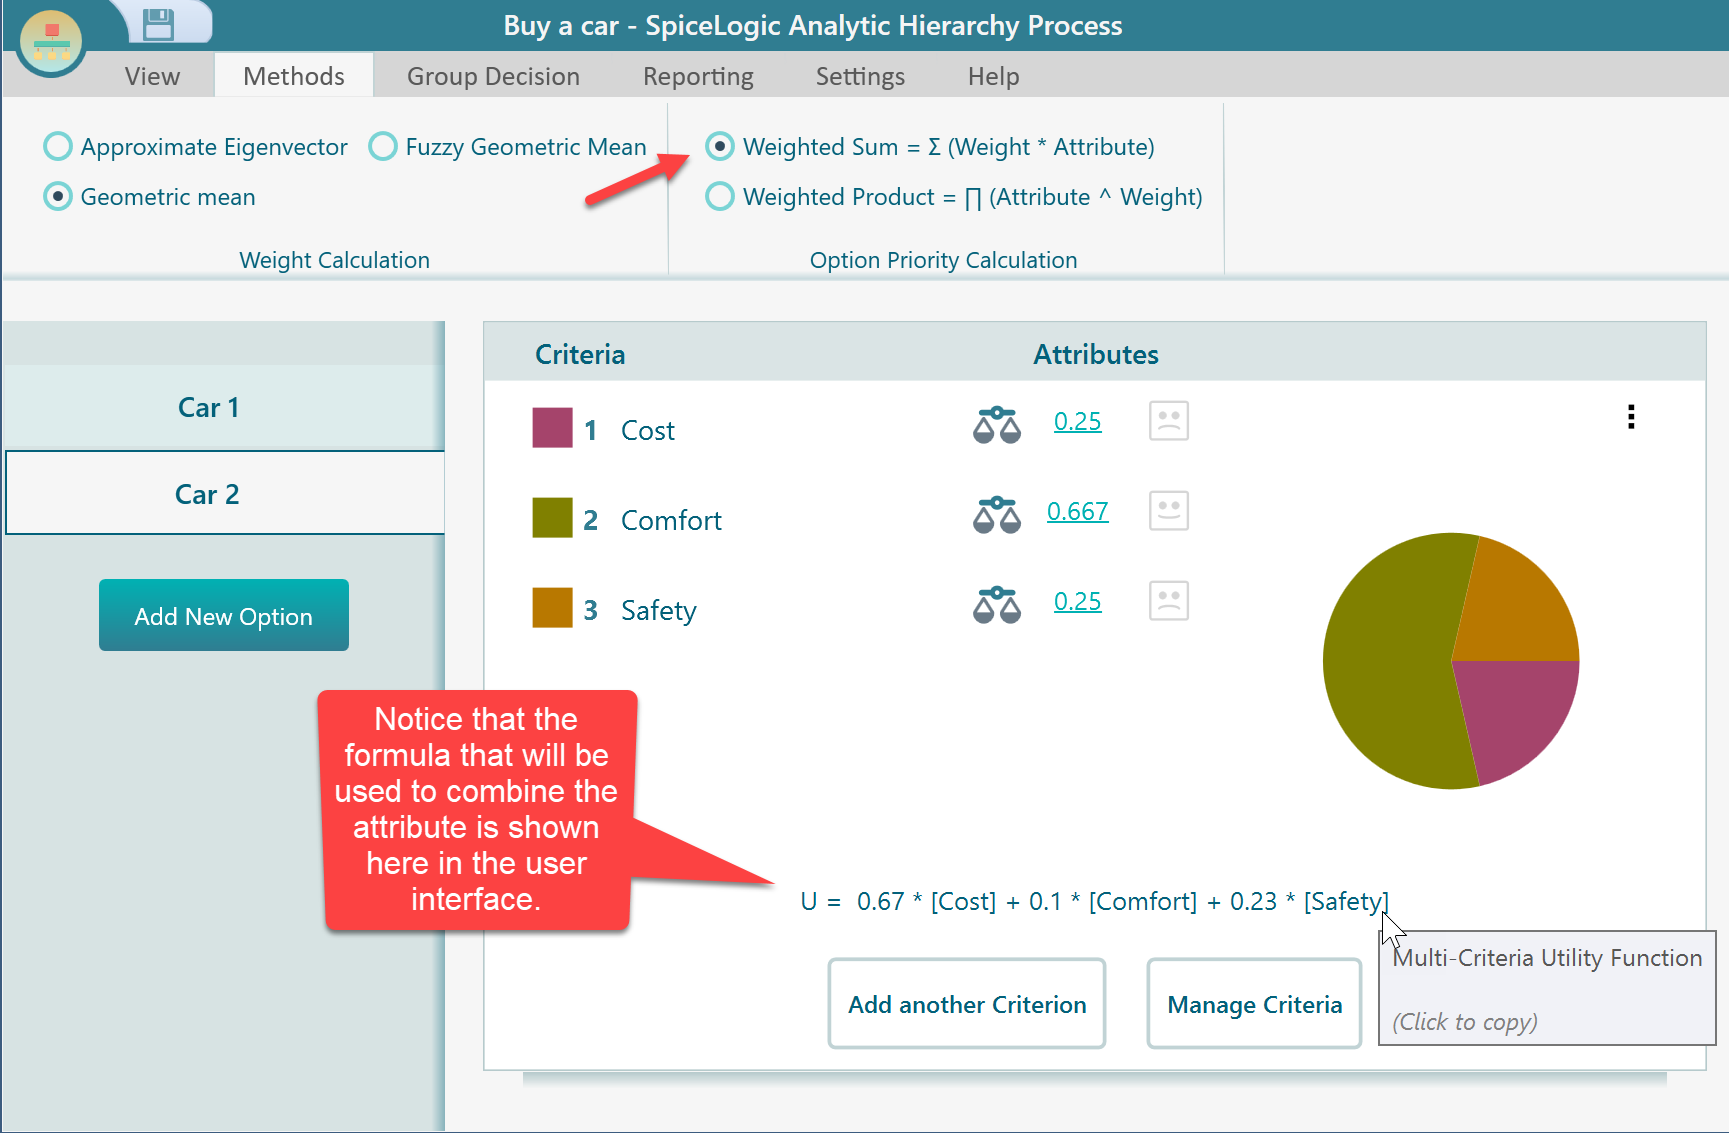
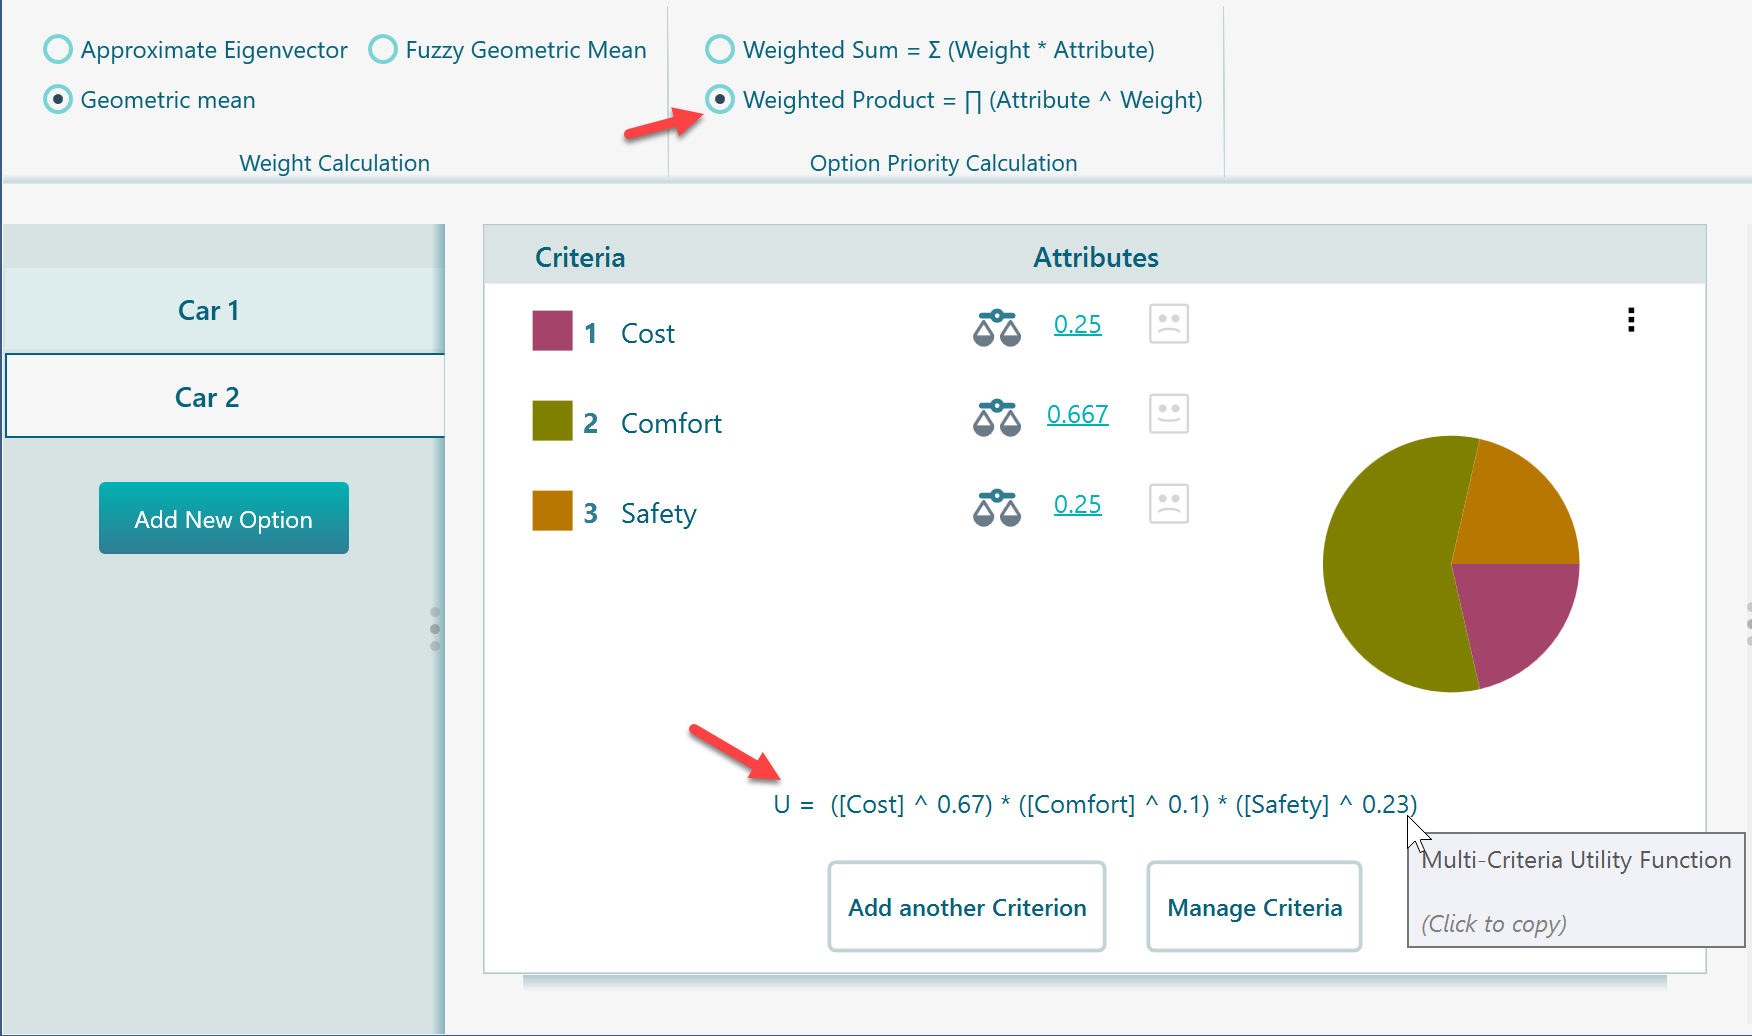
If you switch to "Weighted Product", the displayed formula changes as shown below.
If you keep the Weighted Sum method, the following formula is used to calculate the option value.
= [Weight of Cost factor] * [Cost attribute for Car 1] + [Weight of Comfort factor] * [Comfort attribute for Car 1] + [Weight of Safety factor] * [Safety attribute for Car 1]
Calculate the value for Car 1:
= (0.67 x 0.75) + (0.1 x 0.333) + (0.23 x 0.75)
= 0.71
Calculate the value for Car 2:
= (0.67 x 0.25) + (0.1 x 0.667) + (0.23 x 0.25)
= 0.29
Car 1 scores 0.71, which is higher than Car 2 at 0.29. So AHP Software recommends "Car 1".