


Sensitivity Analysis
What is Sensitivity Analysis?
When you are under pressure and nothing is going your way, you stop worrying about the small stuff that barely changes anything. You put your time on the few things that actually drive the result. Sensitivity analysis does the same thing for a decision. It finds the inputs that matter most.
A decision tree is full of numbers. The probability of an event. The value of an outcome. The payoff at a node, and so on. Sensitivity analysis takes one of those numbers, slides it from a sensible low value up to a sensible high value, and watches for the moment your recommended decision flips. The question is simple: how far does this number have to move before the answer changes? If a tiny change flips the decision, that input is very sensitive, so you should be careful with it. If you can move it a lot and nothing changes, it barely affects the outcome.
An Example of a Dilemma and a Decision
Say you just got a job offer and you are torn. Should you take it, or hold out for something better? If you wait, two things can happen. You might land a better offer soon, or you might stay jobless for a long time. A long stretch with no work is hard. The stress wears you down, and money gets tight. A better offer, on the other hand, leaves you happier and in much better financial shape. So what do you do?
Let's put real numbers on it. The offer in hand pays $90,000 per year. You believe a better offer could pay $150,000 per year. To start, you assume there is a 70% chance you get that better offer, and a 30% chance you end up jobless for a long time. With those numbers in place, we can build the decision tree for this situation.
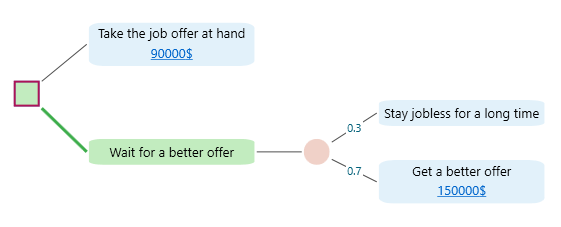
Look at the decision tree above and work out the Expected Value of each action. "Wait for a better offer" comes out to $105,000, which beats the $90,000 from taking the offer in hand. So, on the numbers, you decide to wait.
How Solid Is Your Decision?
You picked the option with the highest expected value. But here is the catch. What if the numbers you fed in are off? Maybe the next offer pays less than $150,000. Maybe that 70% chance of a better offer is too hopeful, and the real odds are lower. If any of those inputs change, your decision could flip.
So the real question is this: if the inputs move a little, does your decision still hold? If it does, you can trust it and move on. If it does not, you need better estimates before you commit. That might mean doing some homework, like checking the job market to get a truer sense of how likely a better offer really is, or finding out the highest salary your skills and experience can actually command.
The next question is which input to study first. You do not have time to research all of them, so you want to spend your effort where it counts. That is what sensitivity analysis tells you. It hands you a list of inputs, each with a number that says how sensitive it is. Let's call that number the sensitivity index.
Sensitivity Analysis in the Decision Tree Software
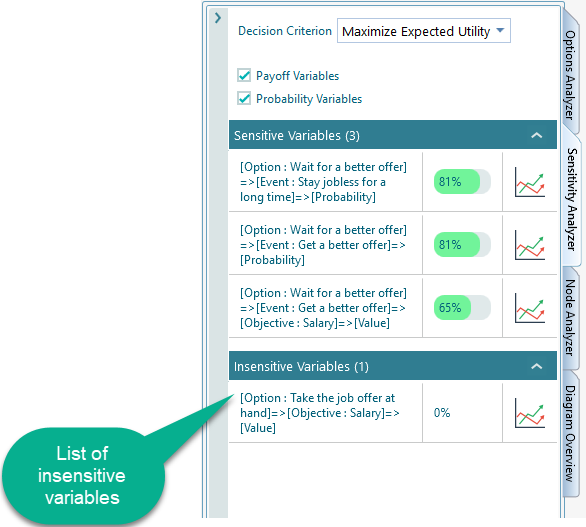
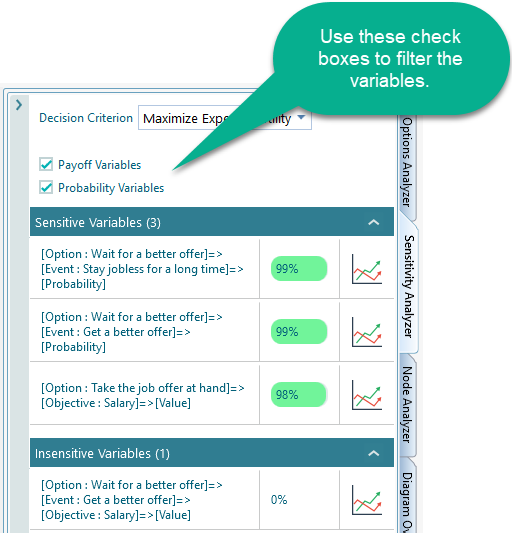
Once you build the decision tree for this job offer dilemma in the Decision Tree Software, you can see the full list of inputs and how sensitive each one is in the Sensitivity Analyzer tab, shown below.
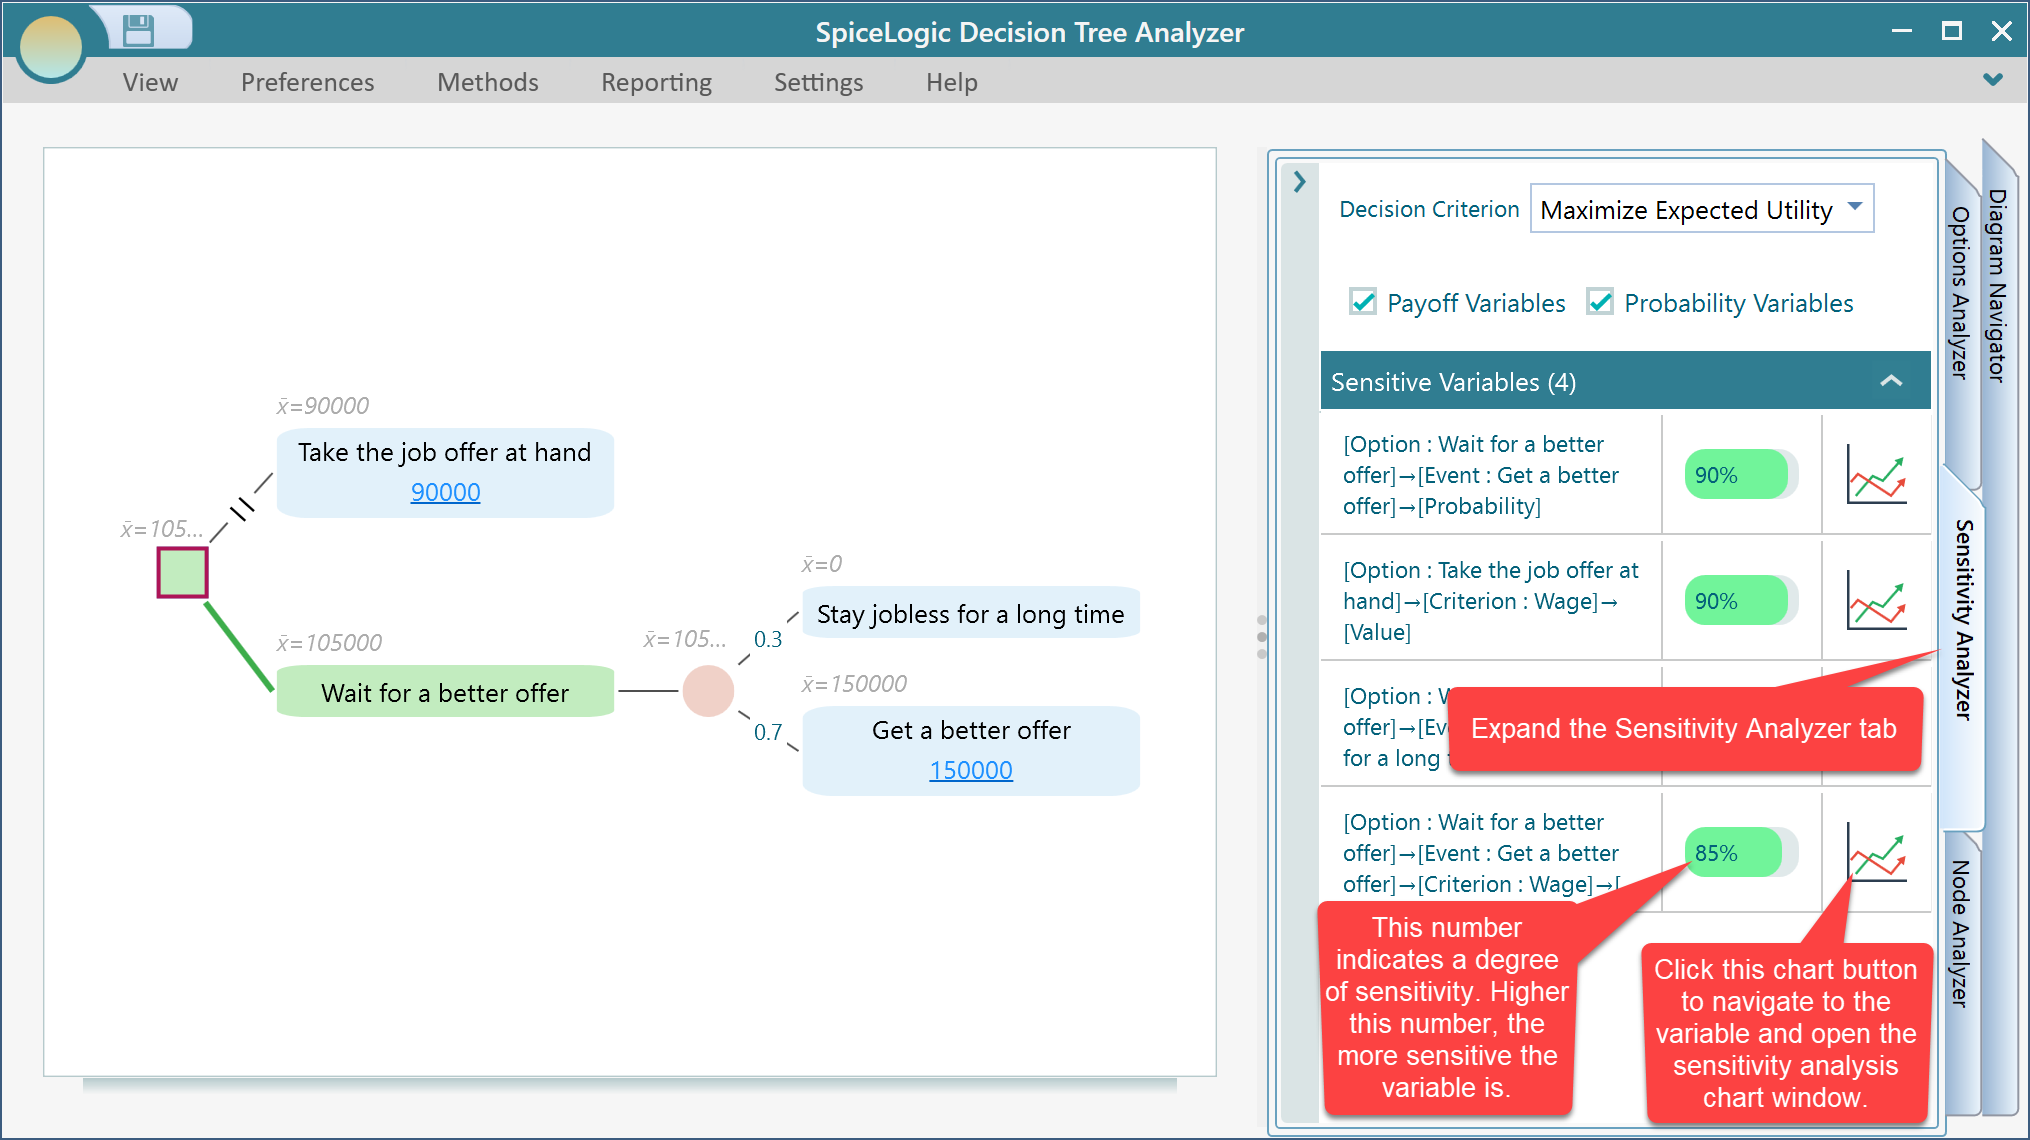
Look at the Sensitivity Analyzer panel and you will see that the most sensitive input here is "Probability that you will get a better offer - if you wait." Its sensitivity index is 90%. In plain terms, this one number is the make-or-break factor in the whole decision. So it pays to think twice. Are you really confident in that 70% chance? It may be worth checking the job market to see how hiring is moving, because if the true odds are lower than 70%, taking the offer in hand might be the smarter move.
You can also use the built-in Bayesian Inference tool to run a few experiments, see what the evidence says, and update your belief accordingly.
The lesson here is short and worth keeping. Finish every decision with a sensitivity analysis, so you know your inputs are solid and you can be confident in the choice you are making.
So what does the sensitivity index actually mean, and where does that number come from? Let's walk through how it is worked out.
The Sensitivity Index Explained
In the Sensitivity Analyzer, each input in the list has its own chart button. Click the chart button next to any input, as shown below, to dig into it.
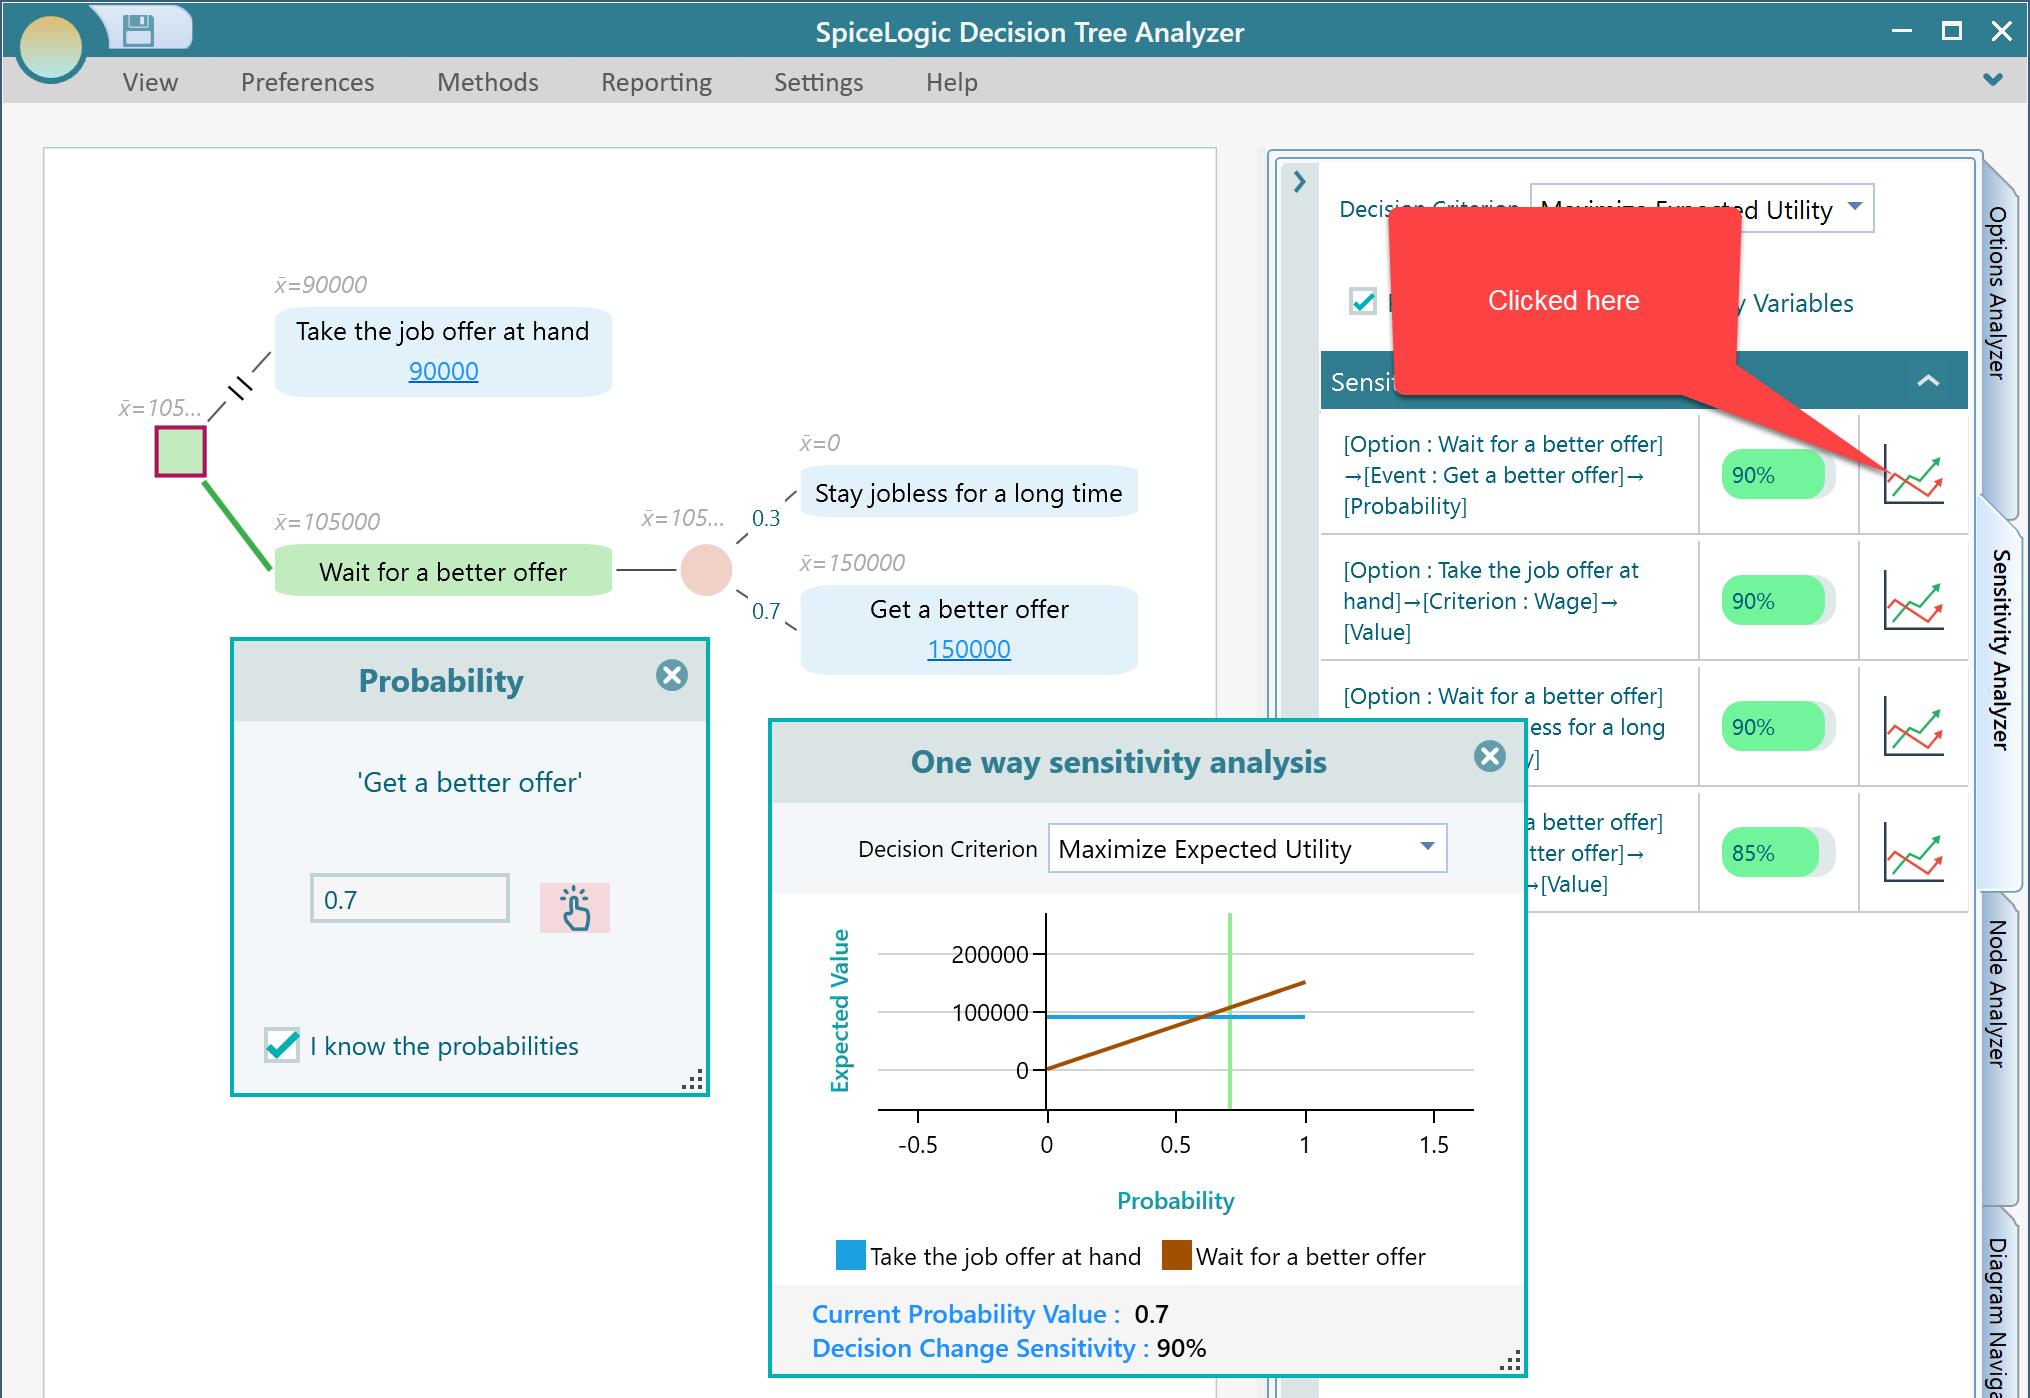
When you click the chart button in the Sensitivity Analyzer panel, the software opens the matching view and draws the sensitivity chart for that input.
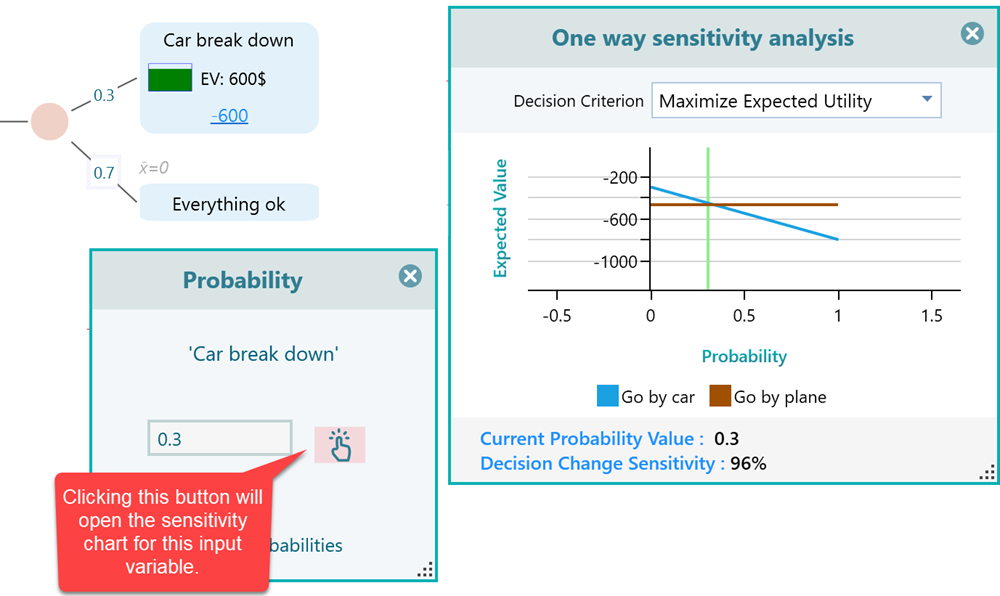
The sensitivity chart plots the Expected Value of your two options on the Y axis against the value of the input you are studying on the X axis. The X axis runs from the lowest sensible value of that input to the highest, so you can watch the expected value of each option rise or fall as the input moves across its whole range. The point where the two lines cross is the value at which your decision flips from one option to the other. For this example, that crossing point is where waiting stops being the better choice and taking the offer in hand takes over.
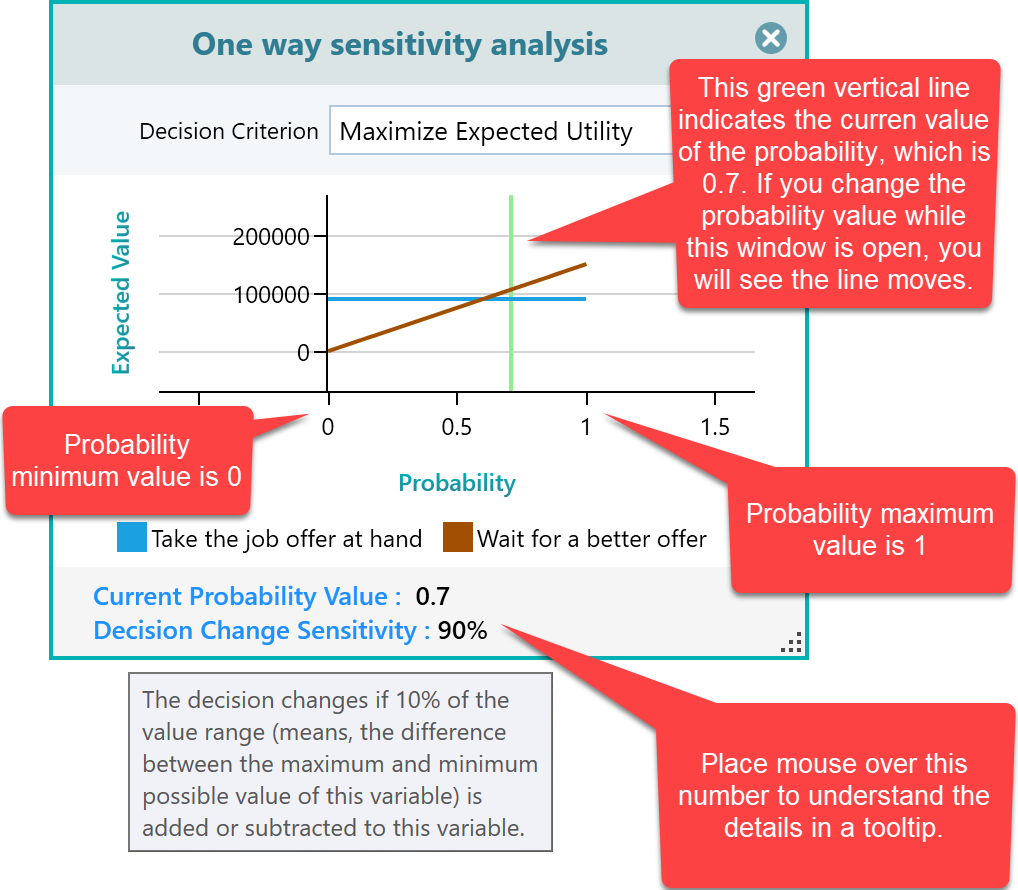
So where does that 90% come from? Hover over the input and the tooltip tells you: "The decision changes if 10% of the value range is added or subtracted to this variable." The software ran the math and found that when the probability moves by 0.1 away from its current value of 0.7, the recommended decision switches to "Take the job offer at hand." Since a probability runs from 0 to 1, that 0.1 shift is 10% of the full range. The sensitivity index uses this formula:
Sensitivity Index = 100 - the percentage of change needed in the input's current value to flip the decision.
So here it works out to 100 - 10% = 90%.
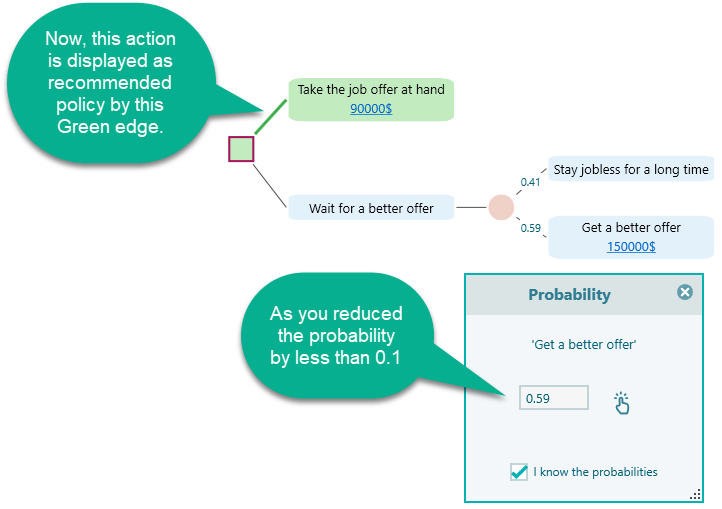
You can prove this to yourself. Change the probability for "Wait for a better offer" to 0.6 (that is 0.7 - 0.1). You will see both actions now have equal expected values, so no option is highlighted as the recommended policy. Now drop the probability by just 0.01 more, to 0.59, and watch "Take the job offer at hand" light up as the highlighted edge. The green edge is the recommended policy.
Why this particular formula? Because we wanted a higher number to mean a more sensitive input, which is the natural way to read it. Think it through. If it takes a big change to flip the decision, the input barely matters, so it should score low. If the tiniest nudge flips the decision, the input matters a lot, so it should score high. We also wanted the index to sit on a percentage scale. Subtracting the percentage of change needed from 100 gives us both of those properties at once.
The two extremes show why it works. If no change at all is needed to flip the decision, meaning any nudge changes the answer, the index is 100 - 0% = 100%, the most sensitive possible. If you have to change the input by 100%, or close to it, before the decision moves, the index drops to 0%. That makes sense too. An input you have to overhaul before anything changes is not an important factor, so we call it insensitive. To keep things tidy, the Sensitivity Analyzer panel lists these insensitive inputs in a separate group, so they do not clutter your view.
Sensitivity Depends on Your Decision Criterion
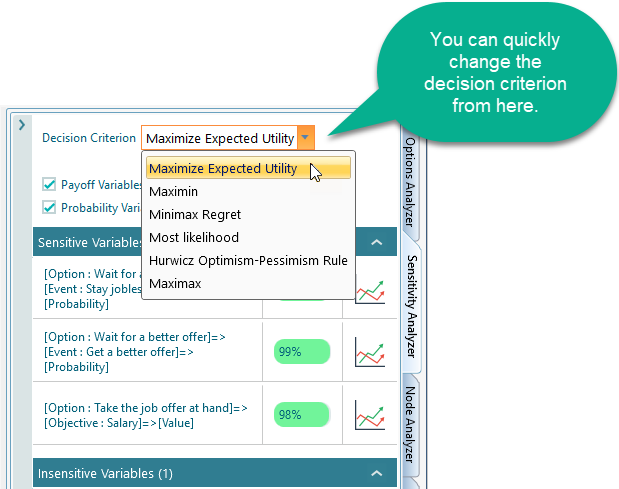
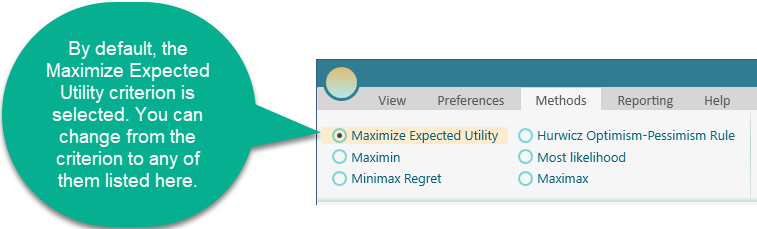
So far we have measured sensitivity using the Expected Value of the outcome. But expected value is not the only way to judge a decision. Maybe you would rather keep down how much you could regret your choice (the Minimax Regret criterion). Or maybe you are cautious by nature and want to judge each action by its worst-case outcome (the Maximin criterion). You can pick the decision criterion right from the Sensitivity Analysis panel, as shown below. When you change it, the sensitivity numbers are worked out again to match the way you have chosen to judge the decision. So an input that looks rock solid under expected value can turn out to be sensitive once you switch to a cautious worst-case view, which is exactly why it helps to check more than one criterion.
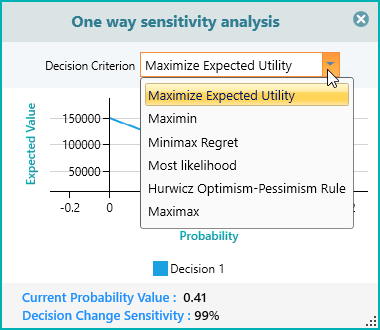
You can also switch the decision criterion straight from the sensitivity chart while it is open, without going back to the panel. This is handy when you are already studying one input and just want to see how the picture changes under a different way of judging the decision. The chart redraws on the spot, so you can compare views in a few clicks.
And of course, you can change the decision criterion from the Method tab on the Ribbon at any time, as shown below. This is the same setting in all three places, so pick whichever spot is closest to what you are doing. Change it on the Ribbon and the whole tree, along with the sensitivity numbers, updates to match.
Filtering Inputs for a Focused Analysis
Sometimes you only care about one kind of input, like the probability inputs, or the payoff inputs. You can narrow the list down to just the type you want by ticking the matching checkboxes. The rest are hidden, so the inputs you are studying are the only ones on screen. This is a real help on a large tree with many inputs. For example, if you only trust your payoff figures and want to stress-test your probabilities, show just the probabilities and ignore everything else.
Check the Sensitivity of Any Input on the Spot
You do not have to open the Sensitivity Analyzer panel every time you want to check an input. Wherever you are editing an input in the software, you will see a small hand button, shown below. Click it and the sensitivity chart for that exact input opens right away. So if a number you just typed makes you nervous, you can test it without leaving your spot in the tree. One note: this button only appears when there is an actual choice to analyze. If you have just one action, or the tree is in a state where there is no real choice between actions, there is nothing to be sensitive about, so the button will not show up.
The Bottom Line
A decision tree gives you an answer, but sensitivity analysis tells you how much to trust it. It shows which inputs your decision really hangs on, so you know where to double-check your estimates and where you can relax. Make it the last step on every decision. Build the tree, read the recommendation, then open the Sensitivity Analyzer to confirm the inputs that matter are solid before you commit. Spend five minutes here and you save yourself from acting on a number that was never strong enough to bet on.