Incorporating Probability Distribution
SpiceLogic Decision Tree Software comes with a built-in Probability Distribution tool. Use it when a payoff in your tree is not one fixed number but an uncertain value that follows a known pattern. Say the cost of a project could land anywhere between $80,000 and $120,000, with the most likely figure near $100,000. You do not have to pick one number and hope. You can describe that uncertainty as a distribution, and the tree works with the whole range instead of a single guess.
The tool shows up anywhere a payoff is a number. When you have a Number type Criterion, open the Payoff popup and you will see the probability distribution button, shown below.
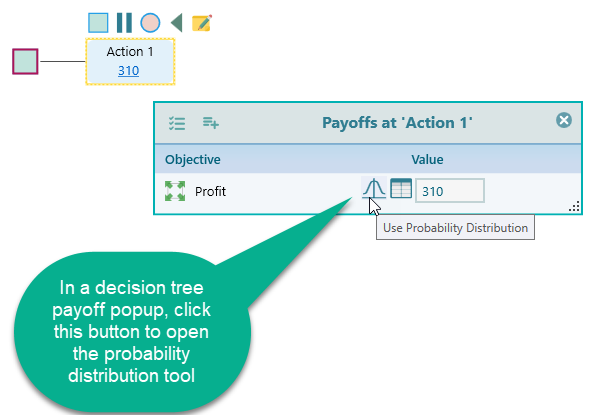
Click that button and the probability distribution tool opens, as shown below. Everything you need is in this one window. You pick a distribution, set its parameters, look at the chart, and read off probabilities, all in the same place. You never have to leave your decision tree to set it up, and when you close the window the distribution you built is attached to that payoff. This keeps your model and the uncertainty behind it in one spot, so it is easy to come back later and adjust.
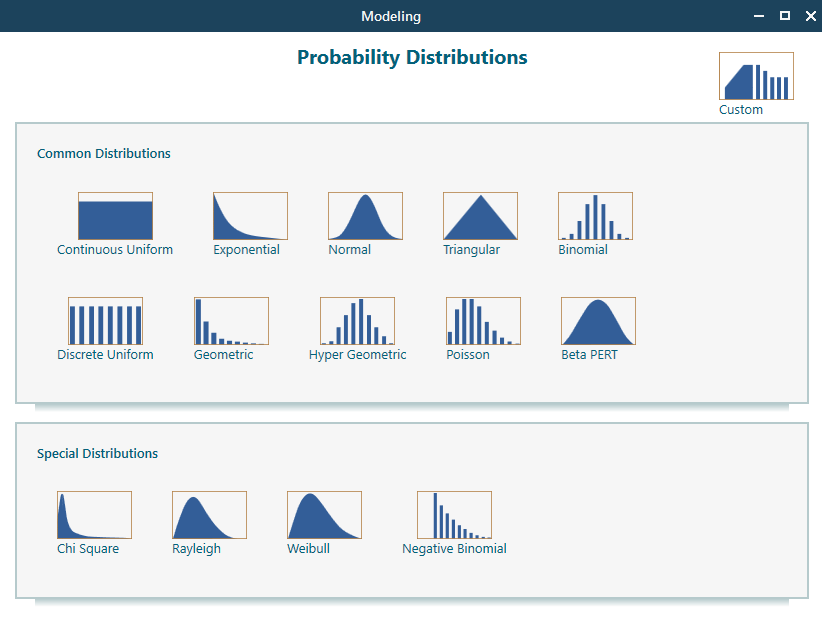
The tool is easy to use. When you open it from a node in your tree, it starts with a gallery of the distributions people reach for most often, shown below. Pick the one that fits your situation. Modeling a count of events, like how many support calls come in during an hour? A Poisson distribution fits. Modeling something that clusters around an average, like delivery time or measurement error? A Normal distribution is a good pick. You are not stuck with the presets either. If none of them match your data, you can build a custom distribution of your own.
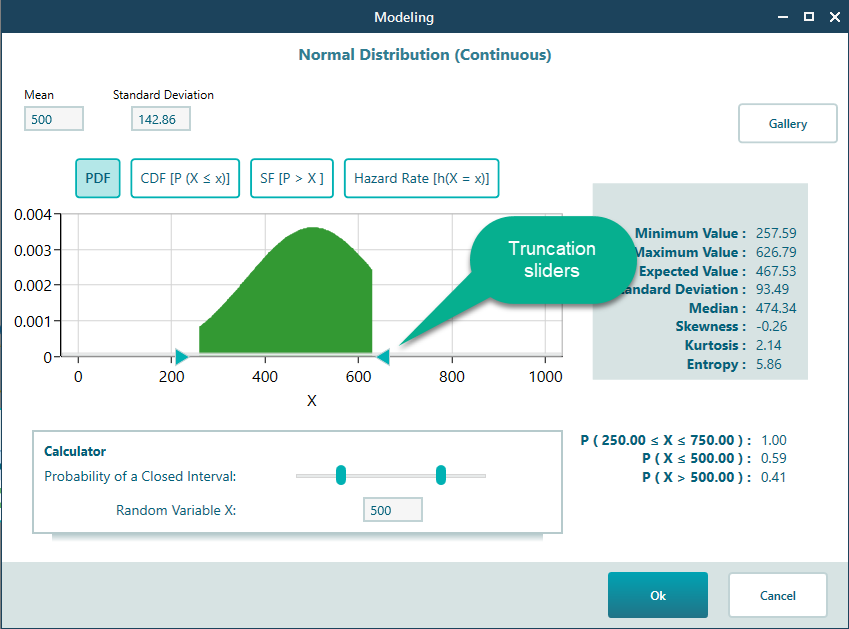
Set the parameters and truncate when you need to
After you pick a distribution from the gallery, you set its parameters, as shown below. Some distributions, like the Normal, stretch out to infinity at both ends in theory, even though your real values never go that far. When that happens, you can truncate the distribution. Set a minimum, a maximum, or both, so the values stay inside the range that actually makes sense for your problem. Delivery time is a good example. It can never be negative, so you would cut off the lower end at zero.
Look at the distribution from different angles
By default the tool shows the Probability Density Function for a continuous distribution, or the Probability Mass Function for a discrete one. That is the familiar curve or bar chart that shows how likely each value is. Sometimes a different view answers your question better. Want to know the chance that a value falls at or below a given point? The Cumulative Distribution Function shows that directly. The Survival function shows the opposite, the chance of being above a point, which is handy for time-to-failure or how long a part lasts. The hazard rate shows the risk of failing right now, given that it has lasted this far. You switch between all of these views with the buttons shown below.
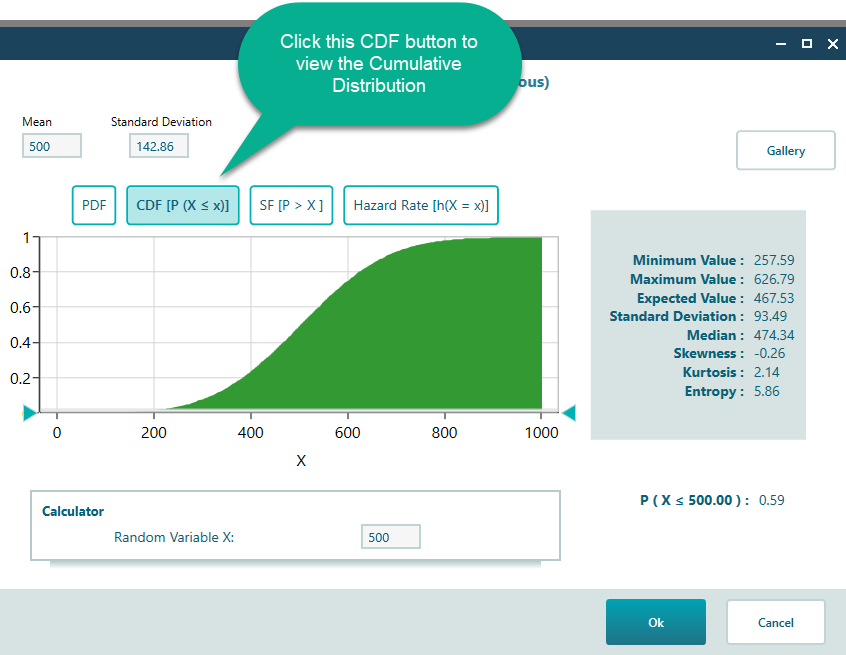
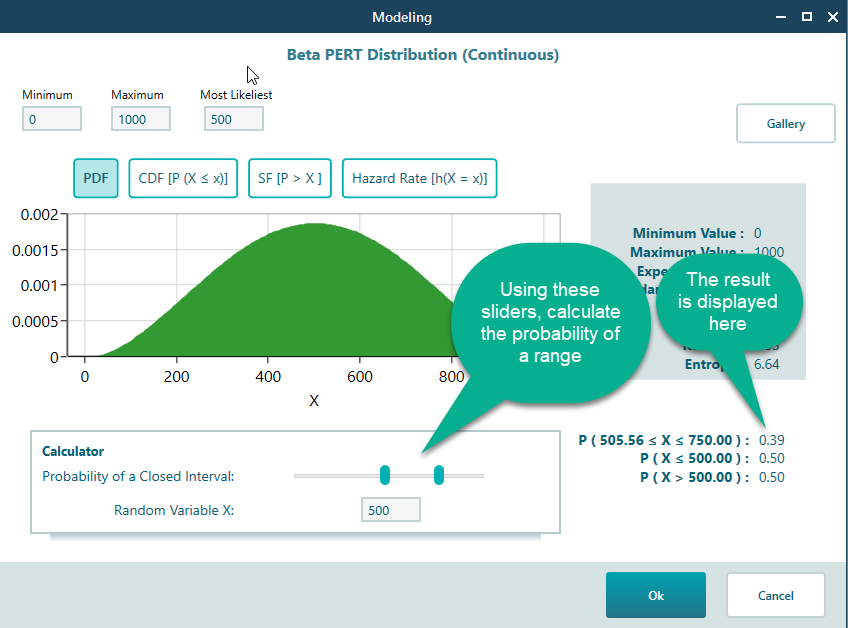
Calculator
Once your distribution is set up the way you want, the built-in calculator lets you read real probabilities straight off it. Drag the sliders to mark a range, and the tool tells you the probability that a value lands inside it. For example, you could ask how likely the project cost is to come in under $110,000, or how likely it is to fall between $95,000 and $105,000. For a continuous distribution it is the range that carries the meaning, since the chance of hitting one exact value is basically zero. For a discrete distribution you can also read off the probability of a single specific value. It is a quick way to sanity-check your model before you let it drive the decision tree.