Results and Charts
SpiceLogic AHP software is full of visualization. Every dataset is displayed as a set of stunning charts. You will find chart carousels here and there everywhere in the application.
Criteria Weight Results
In the Pairwise comparison panel, you encounter the first charts-carousel as shown below.
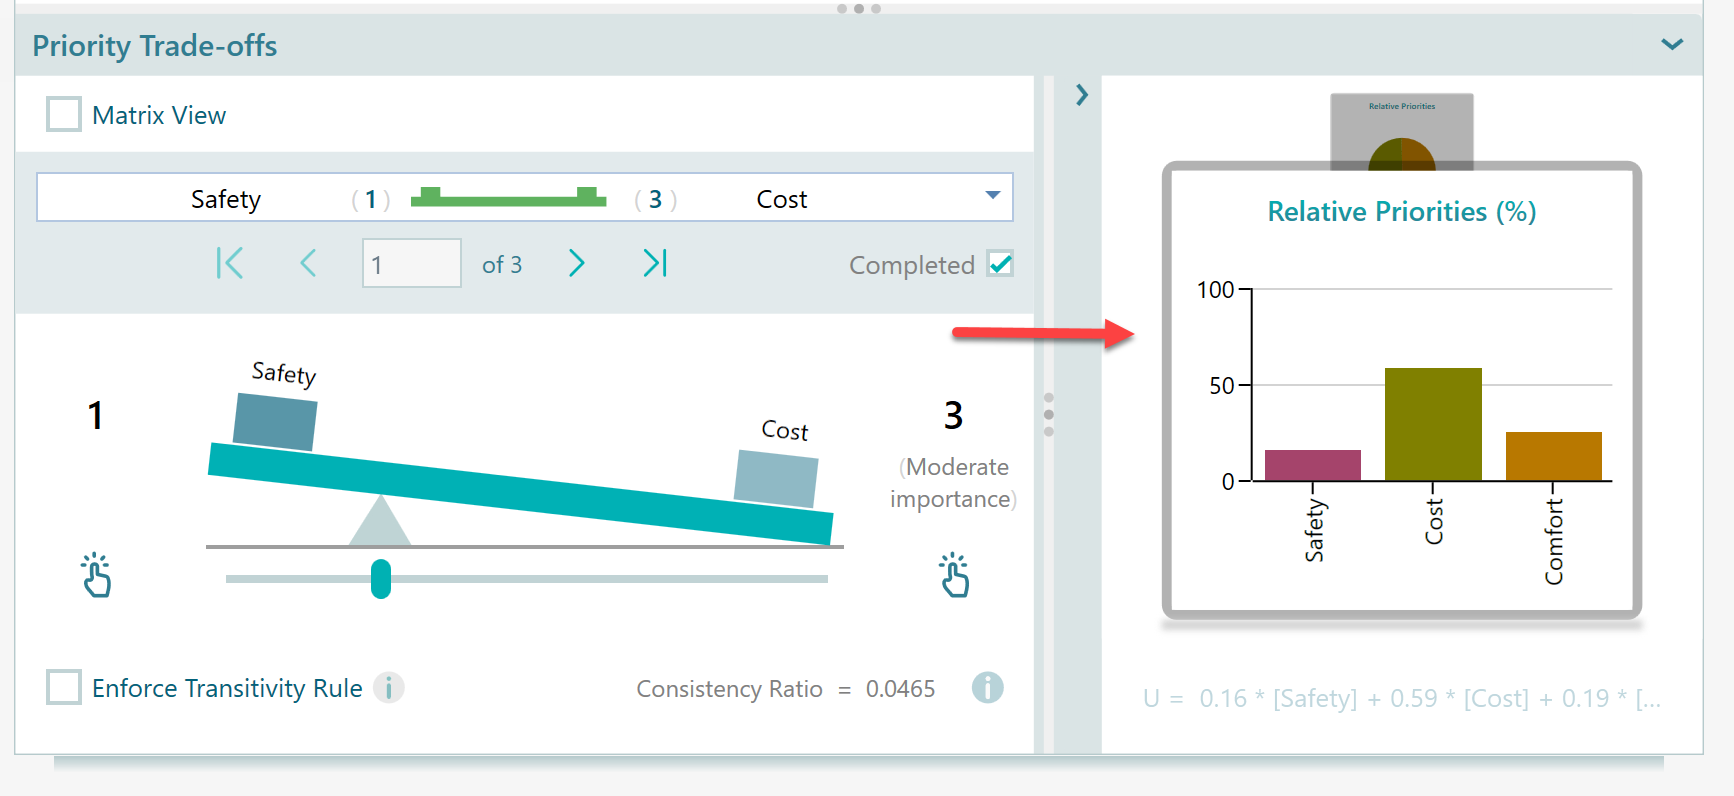
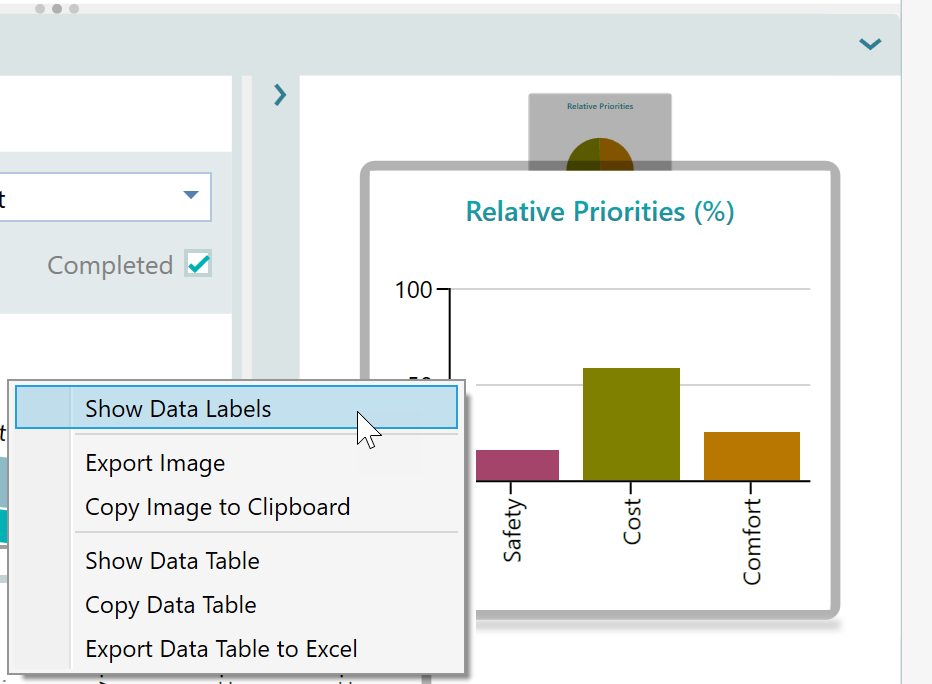
Right-click on the chart to see various options like displaying the data label, copying the chart into the clipboard, viewing the data table, exporting the data table to excel, etc.
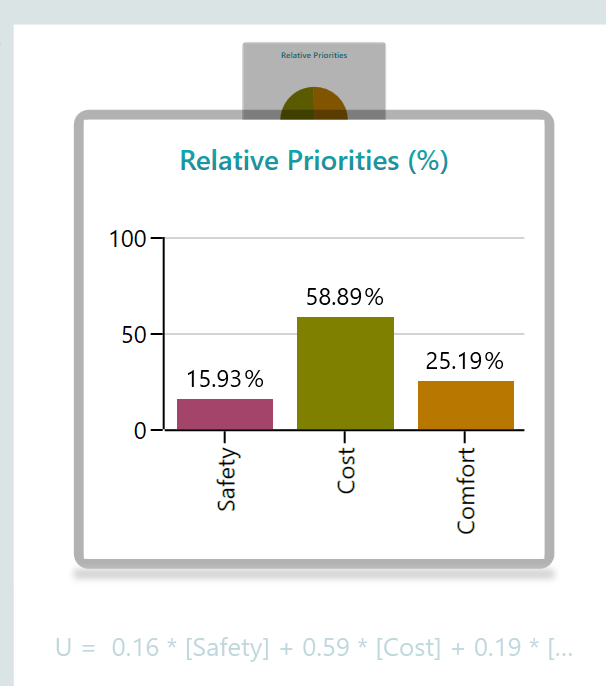
After clicking on the data label, you will see this view with numbers over the columns.
In the same carousel, you will see this distribution as a pie chart, as shown below.
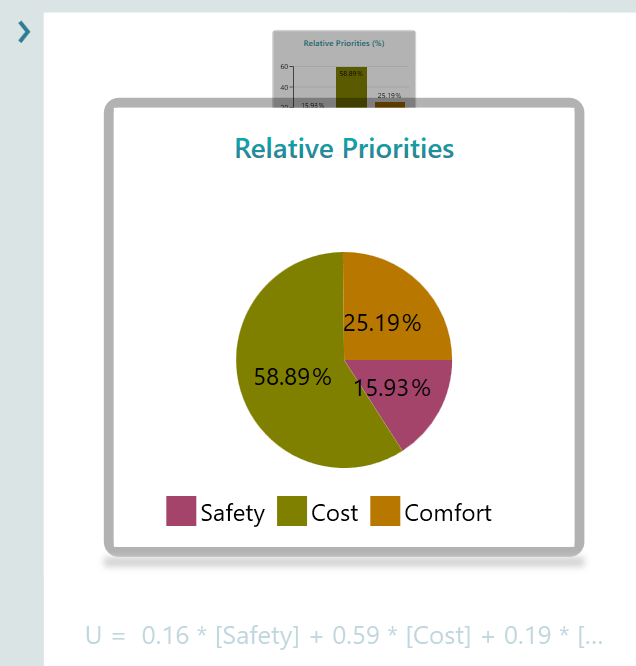
Please note that, by default, the data labels are not shown on charts to give a clean look, as the numbers look messy over a chart. But feel free to display the data labels when you need them. As you can see in the above screenshot, the data label is turned on.
Option Results
You can click on an option from the left vertical menu bar to see the option's criteria attribute distribution.
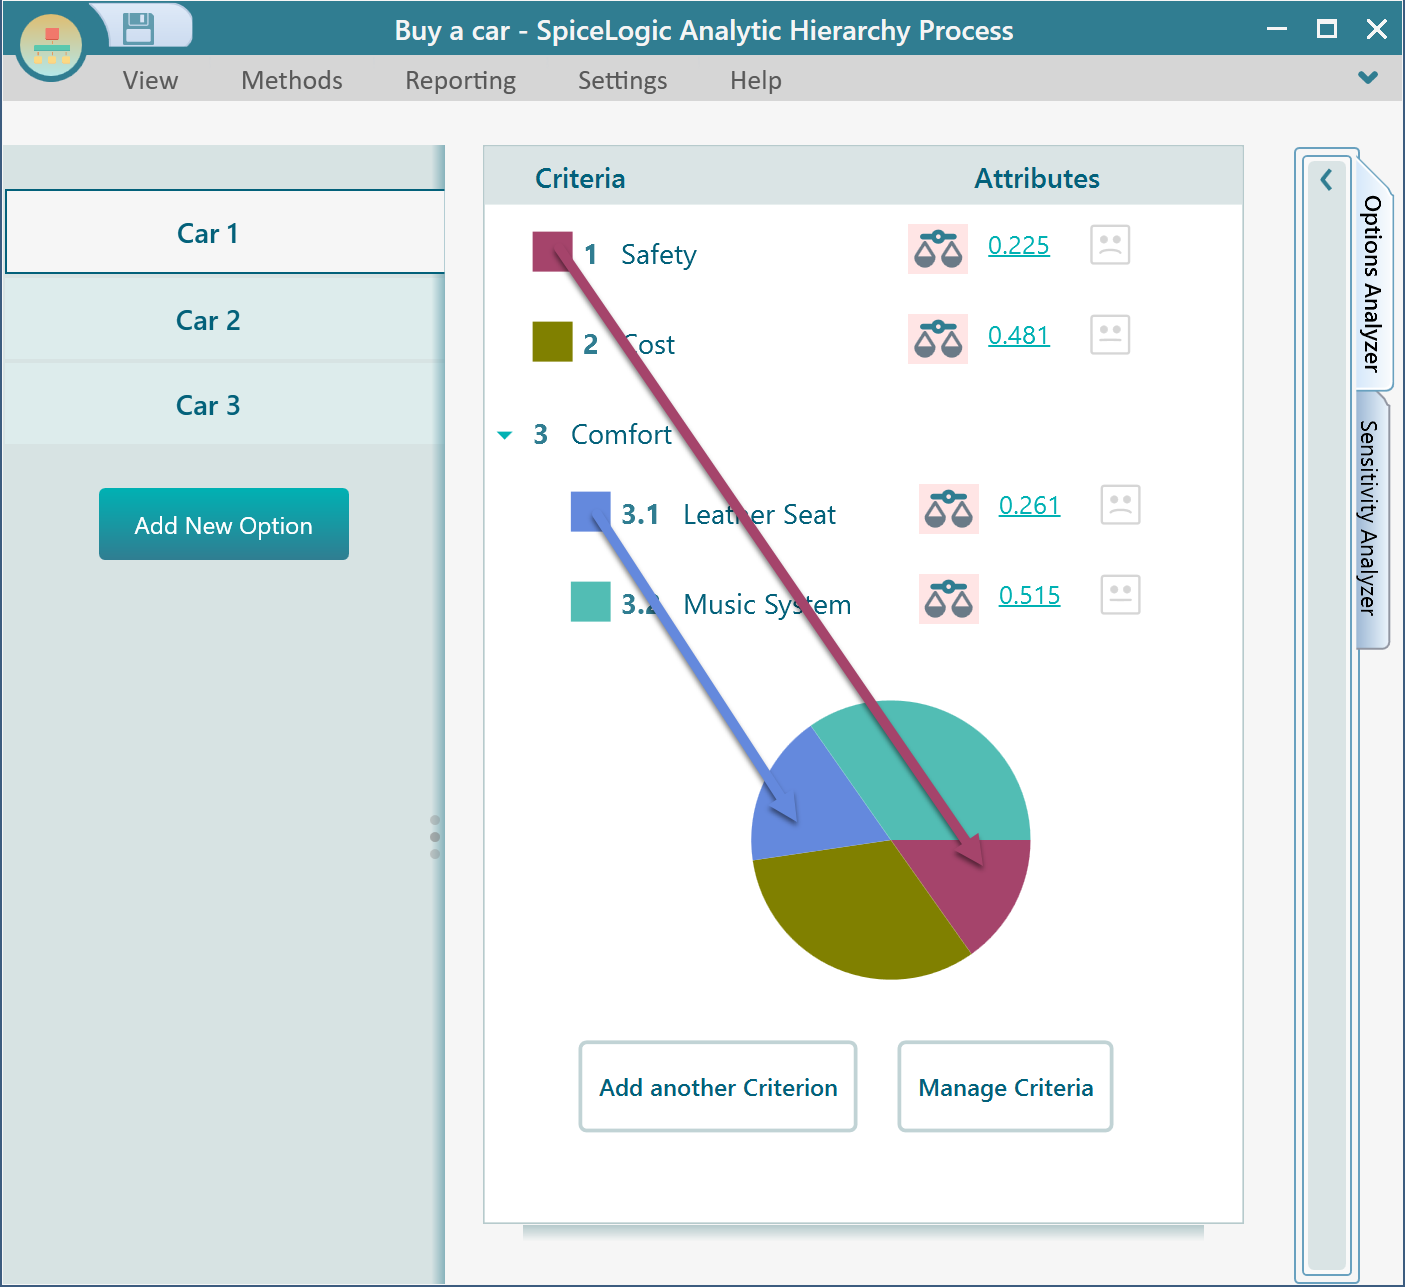
Notice that for the option "Car 1", every criterion attribute is displayed on that page. And a pie chart displays the relative distribution of these criteria attributes. Notice the pie color in the chart are matching the boxes beside the criteria names.
Overall Decision Results
Once you completed modeling the AHP, you will see a chart carousel in the Options Analyzer panel. In this carousel, you will find various useful charts like Priorities, Attributes Radar Chart, Weighted Attributes, etc.
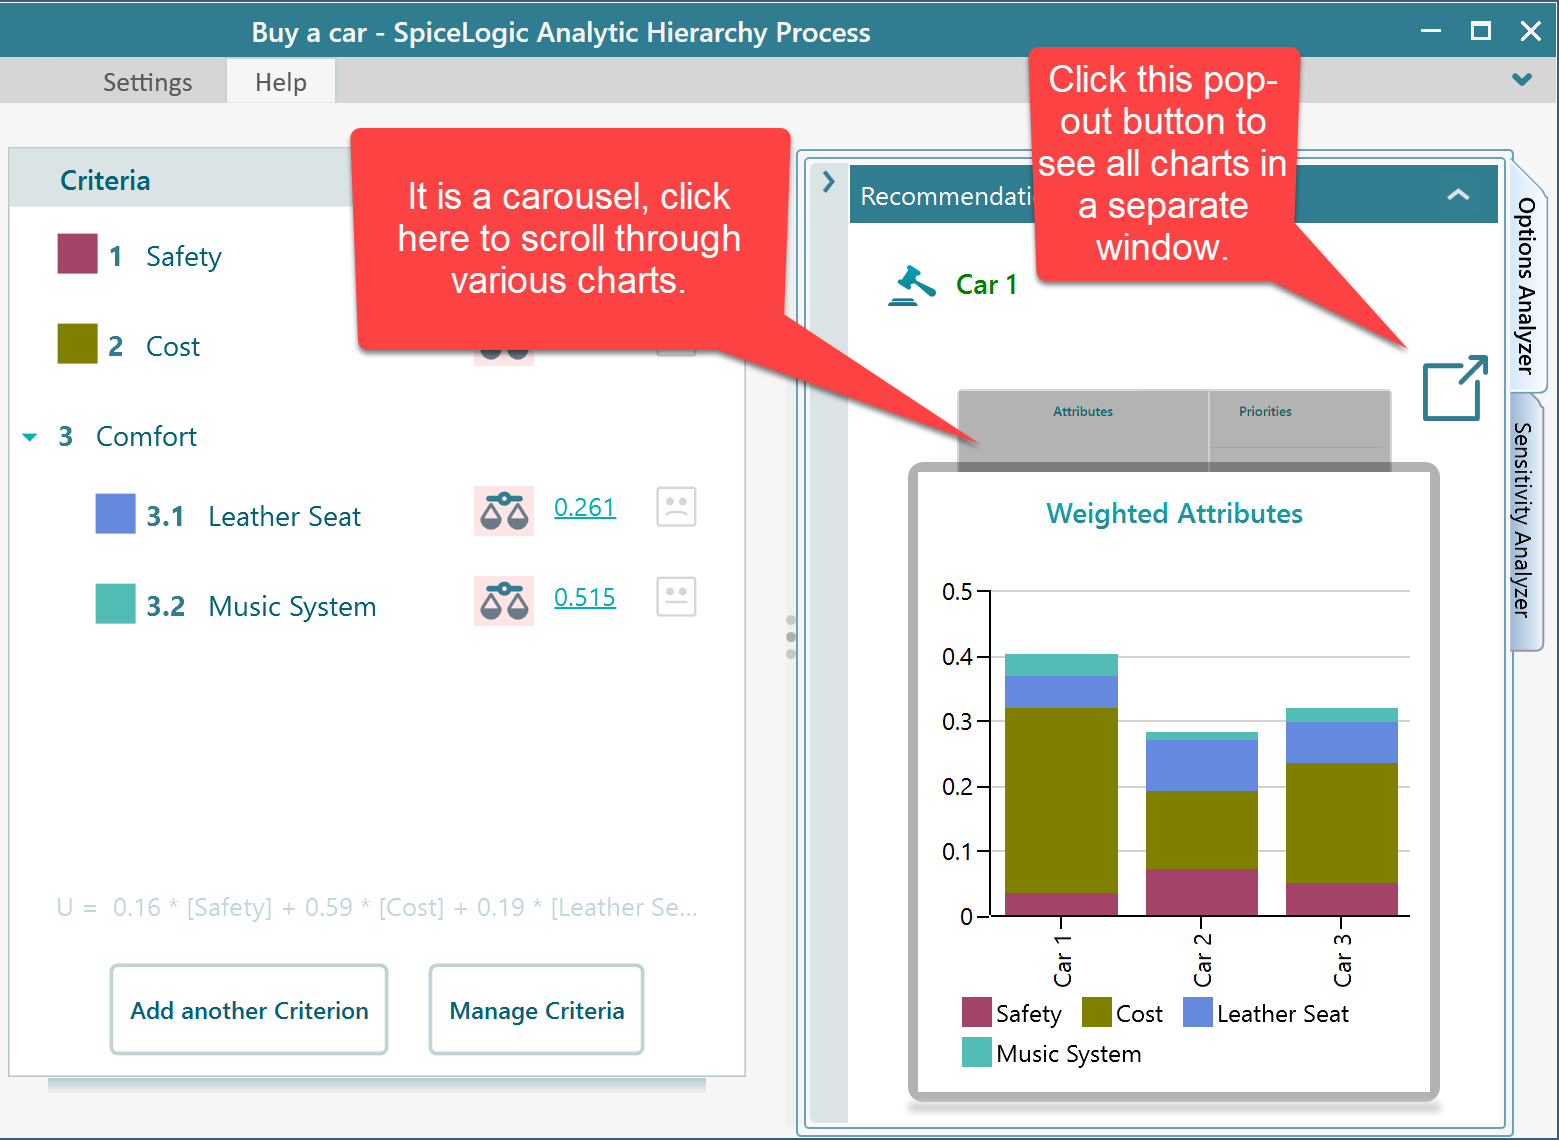
You can click that pop-out window as shown in the above screenshot, to see all the charts in a separate window, as shown below.
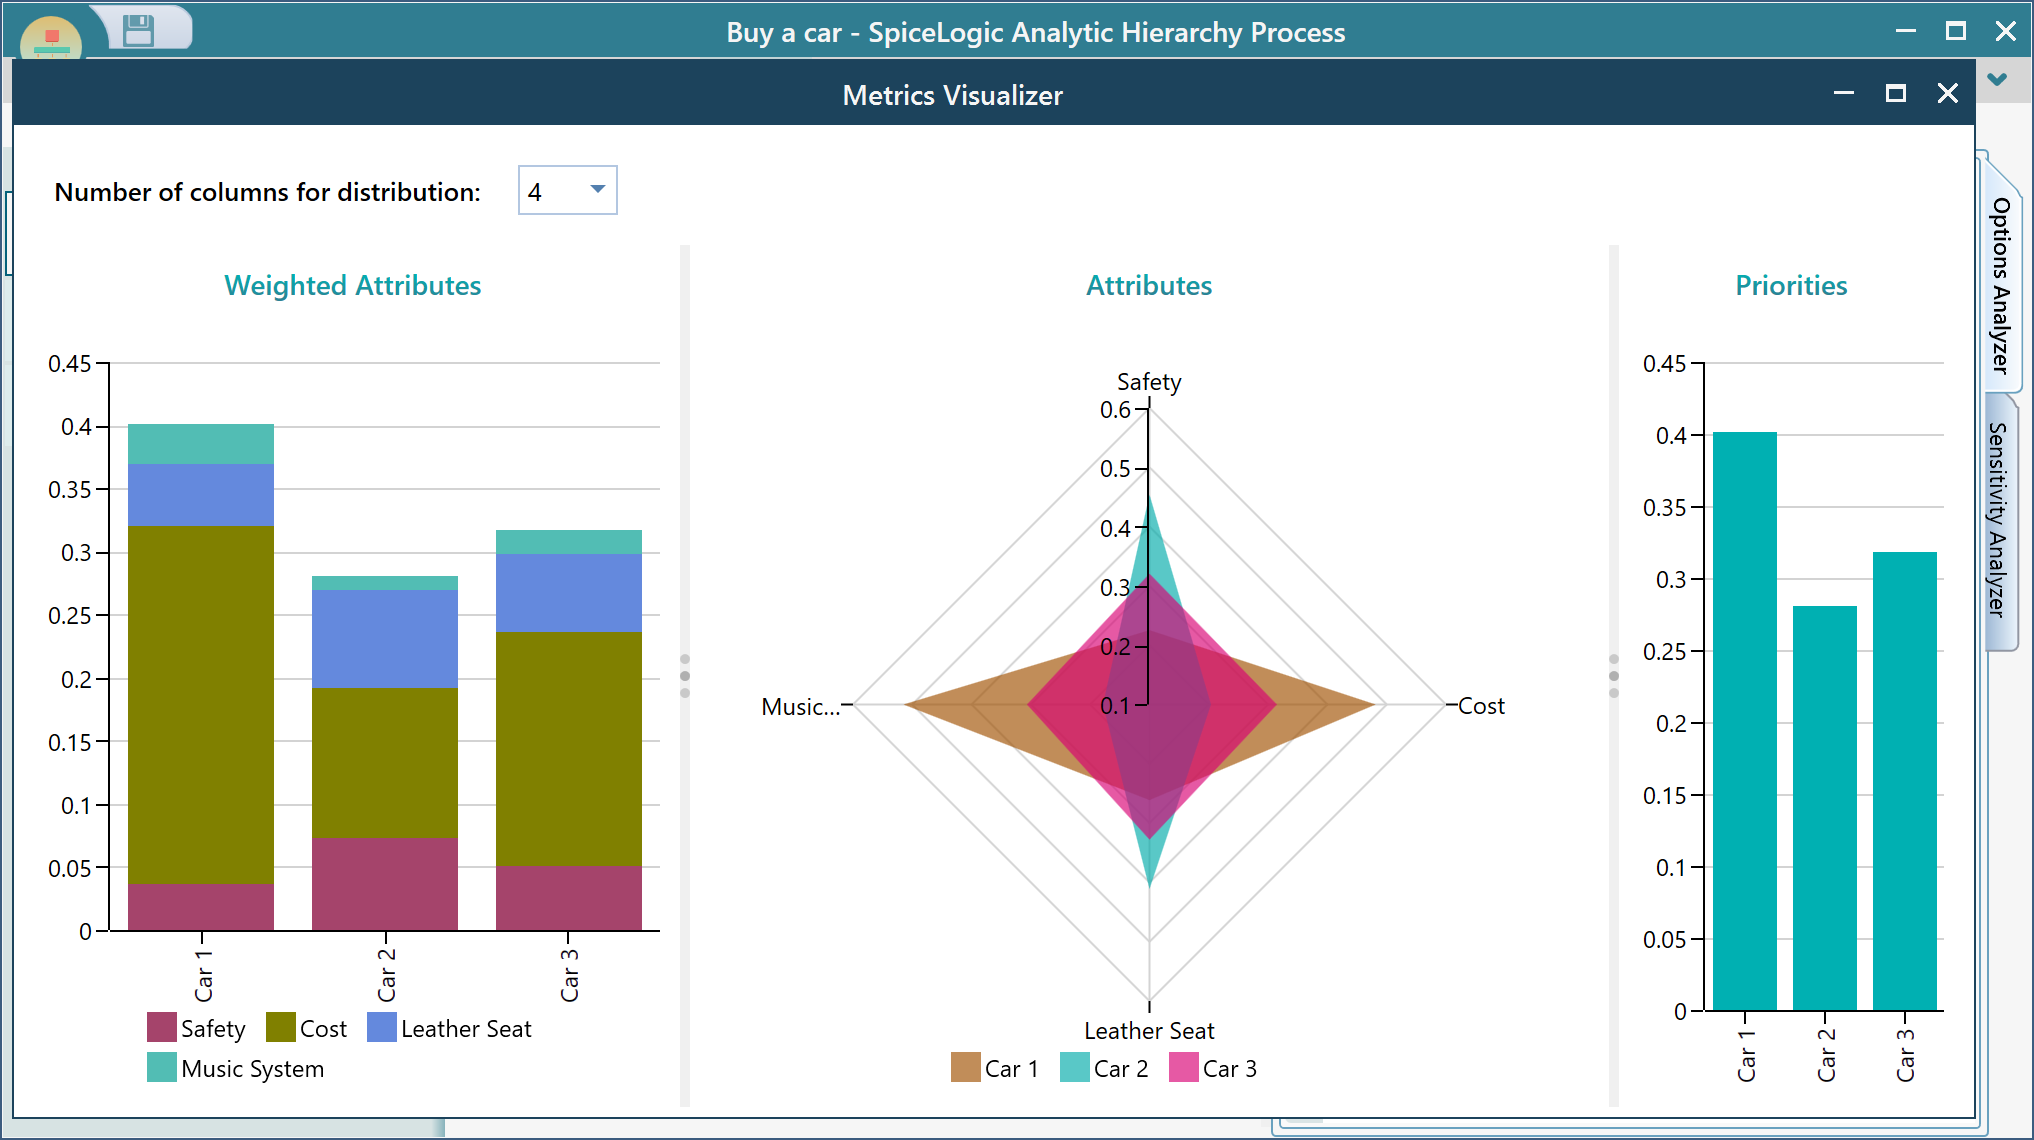
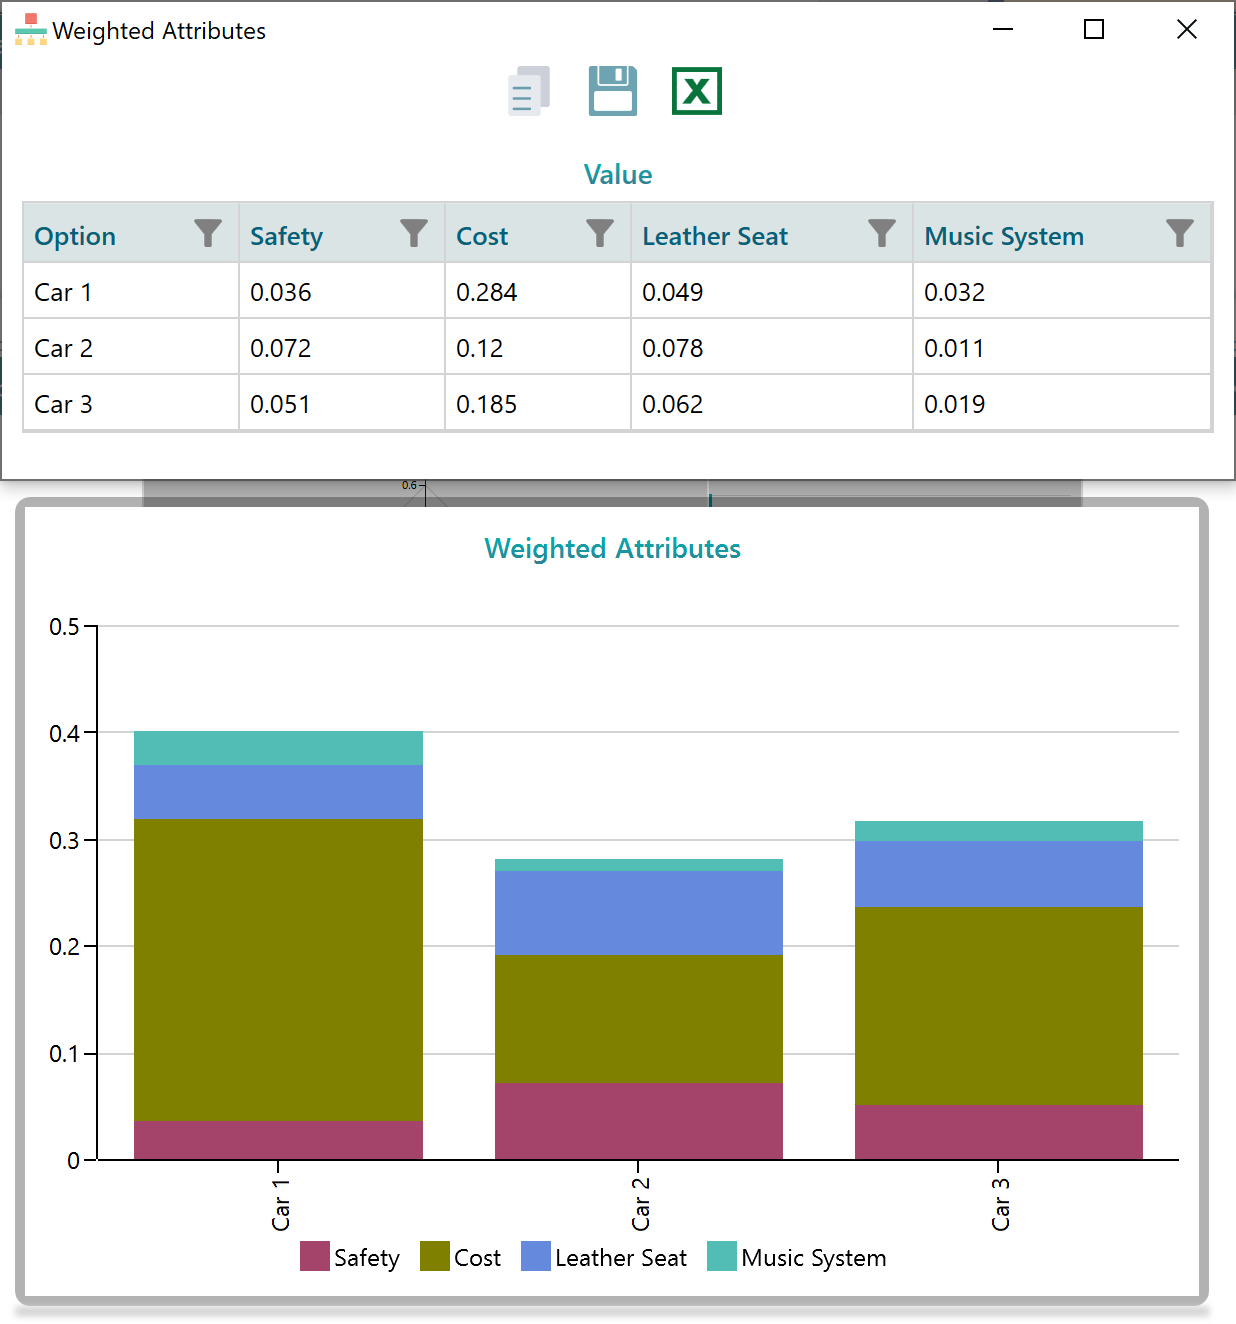
Notice the weighted attributes chart. You can click on a legend to show or hide the specific criterion and see the overall result after removing that specific criterion. For example, in the above chart, you see that "Cost" is basically affecting the result significantly. Now, you might be thinking, what if I don't consider "cost" as a problem. Then what option would be best for you!. Click on the "Cost" legend to disable it and see the change, as shown in the following screenshot.
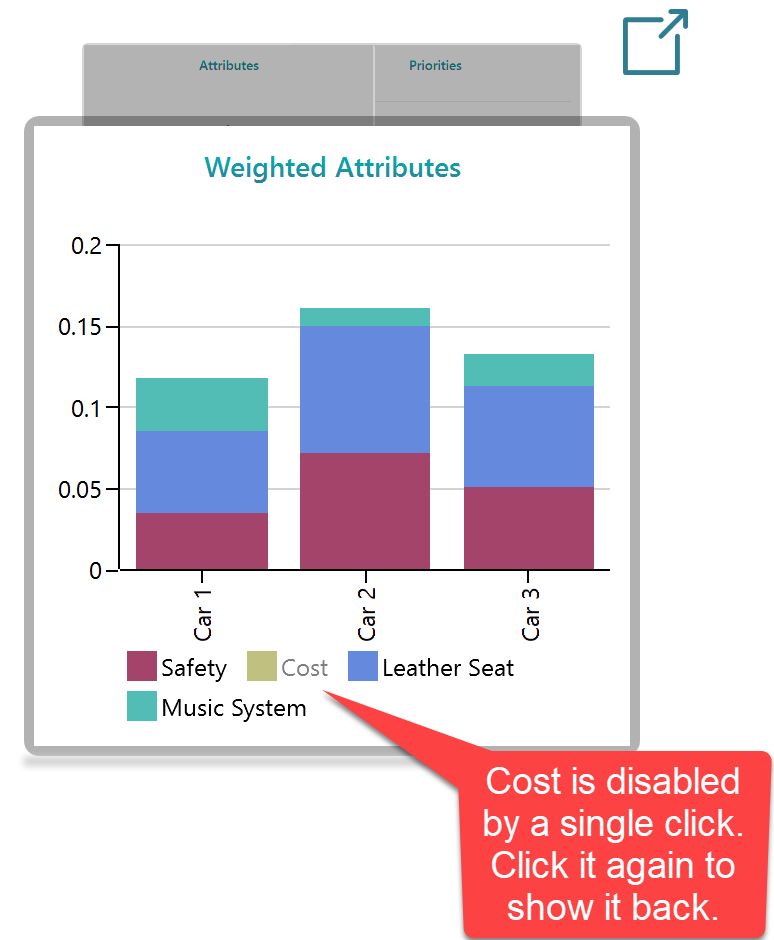
Now, see, after disabling the "Cost" criterion temporarily, you see, "Car 2" becomes the best choice instead of "Car 1". With considering "cost", "Car 1" was the best choice. Now, it is changed.
Now, look at the attribute radar chart. This radar chart shows the criterion attribute for an option. You can click on a legend for an option to show or hide a specific option so that you can see one or two options more clearly. For example, in the following screenshot, We have 3 options shown in the radar chart, which is kind of chaotic.
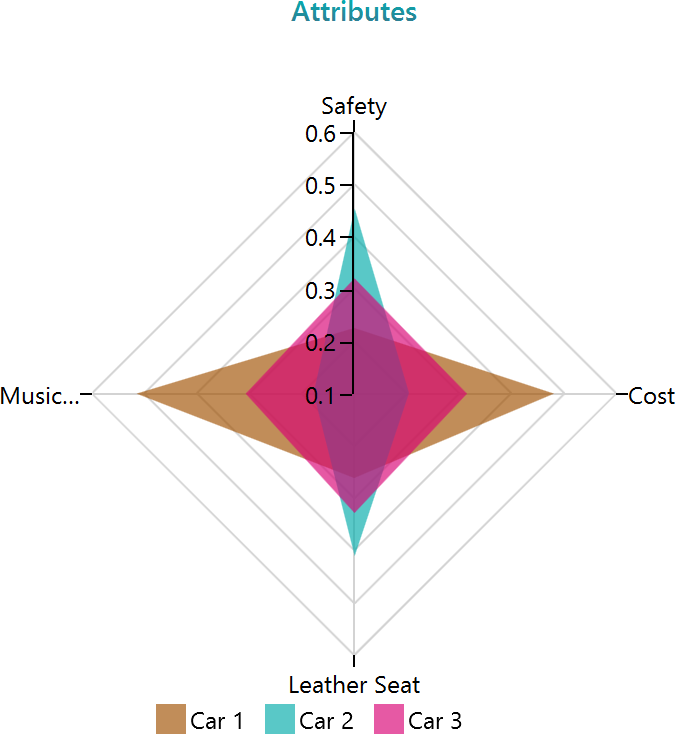
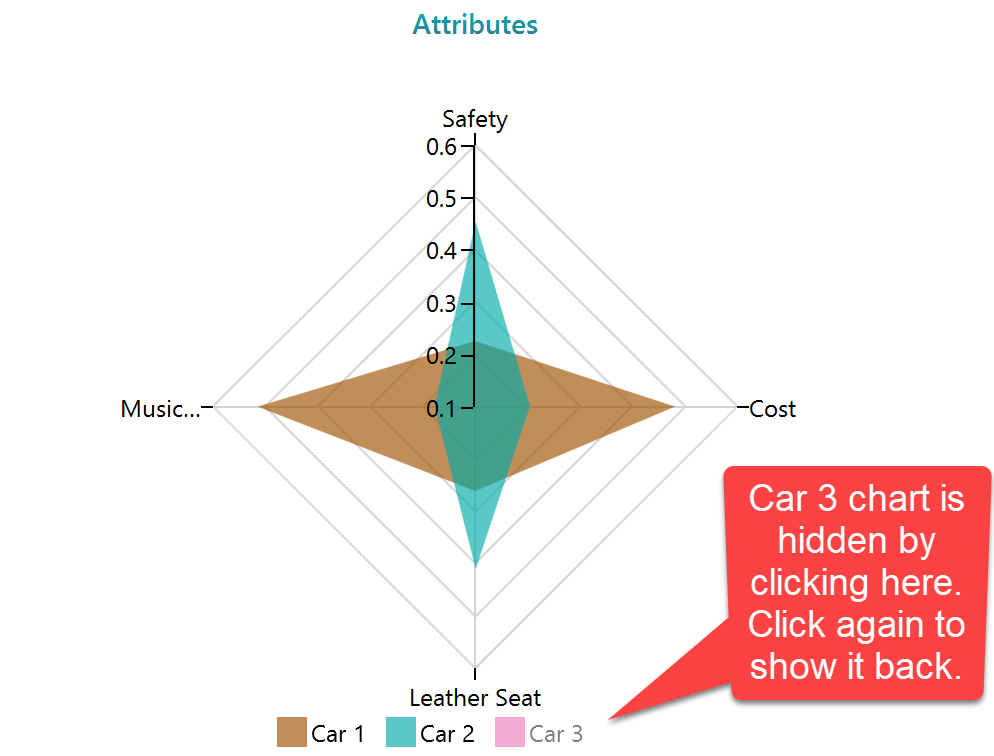
So, say, you are not interested in "Car 3", you can hide the "Car 3" by clicking the legend and you will have a clearer view of the other two options.
The other chart is the Priority Chart, which is a simple column chart that shows the calculated total criteria weighted sum (or criteria weighted product based on the calculation method). Basically, this is the main chart that you may check most of the time to find the best option.
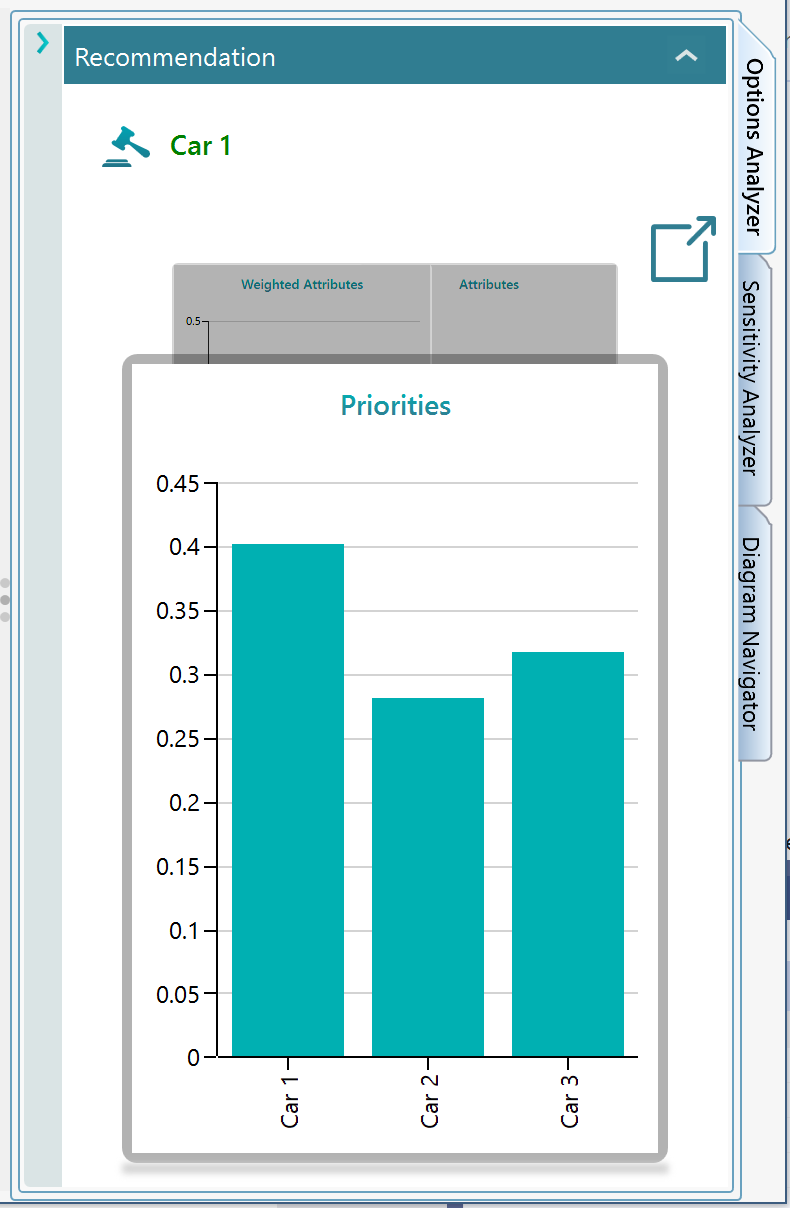
Chart features
Every chart in this application comes with a common set of features. For example, you can show the data labels, show the data tables in a data grid window, export the data into Excel, or copy the data in the clipboard as CSV, which you can paste on Excel or a notepad. You can copy the chart image into the clipboard, you can save the chart image as PNG or JPG, etc. Just right mouse click on a chart and you will see all these options.
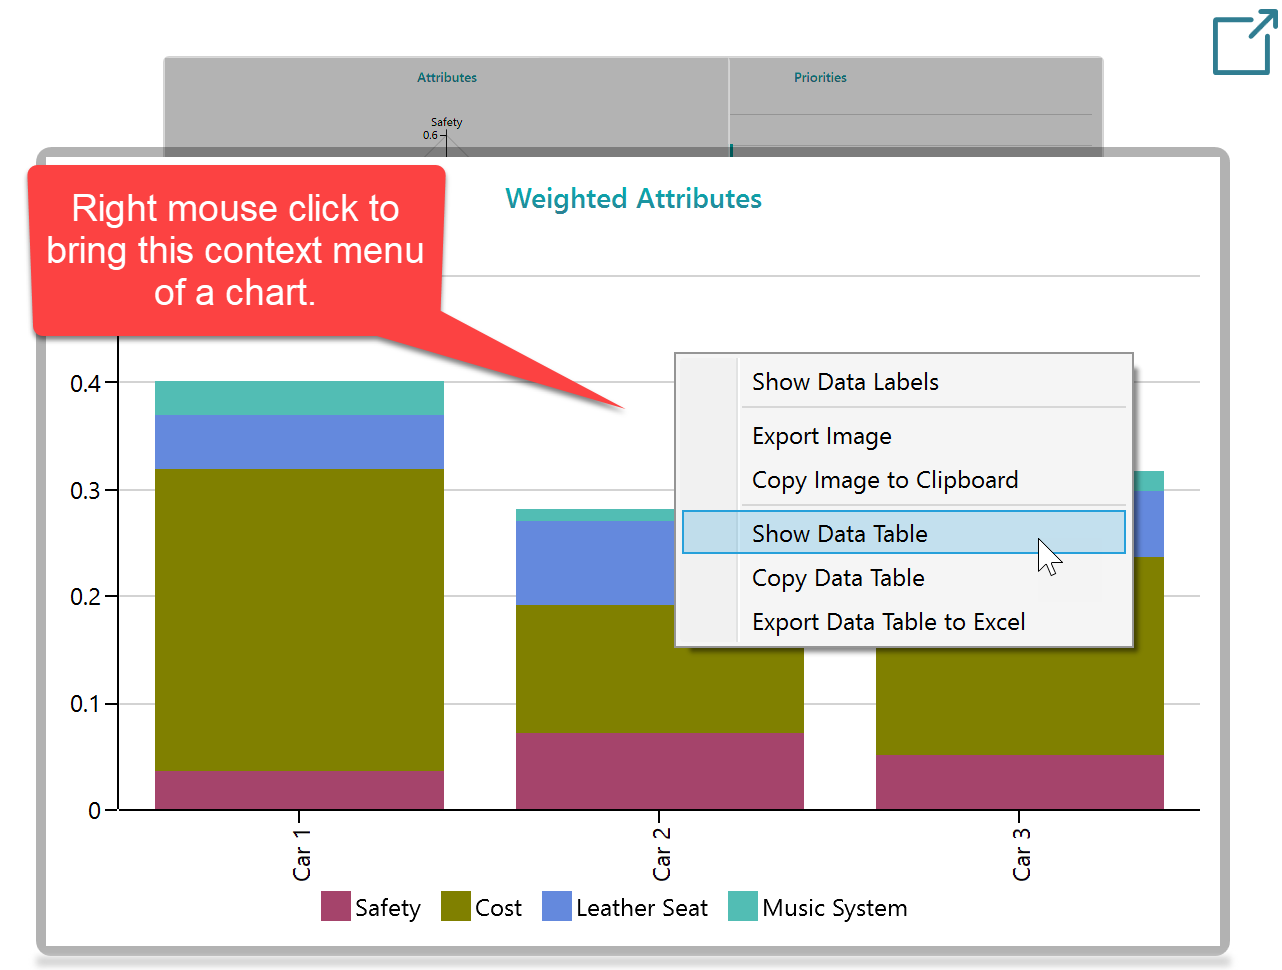
For example, once the "Show Data Table" is clicked for the above chart, the following data grid window is displayed. Notice that, in addition to clicking the context menu "Export data table to Excel", you can export the data table to excel from that separate data table window as well. Notice that, in this data table, you can perform various query operations like sorting, filtering, etc
Sensitivity Analysis Charts
You will find more charts in the Sensitivity Analysis panel as discussed here.