Modeling Uncertainty
Real choices are rarely certain. The Decision Matrix can hold that uncertainty for you, so your analysis matches the real world instead of a tidy guess.
Here is a situation many people face. You get a job offer with good pay, but the office is far from home. The commute is almost 2 hours each way. You could turn the offer down and hold out for something better, but waiting has its own risk. If a better offer takes a long time to show up, you may get frustrated and end up taking something worse than what you have right now. So what should you do? There is no obvious answer, because so much depends on things you cannot know yet.
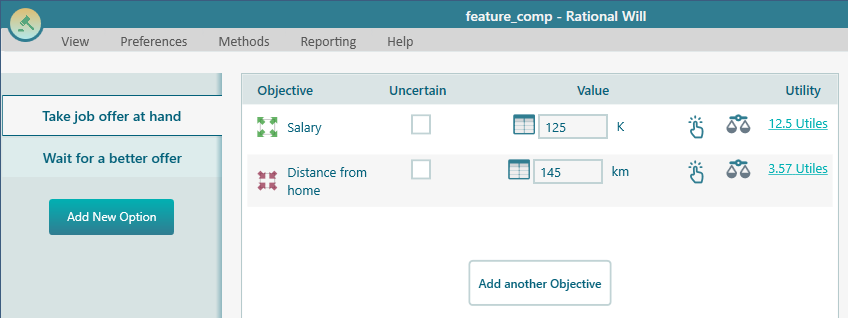
Let us put it into the matrix. You have two objectives: get the highest salary you can, and keep the distance from home as short as possible. You set up these two objectives the same way as on the Getting Started with Decision Matrix page. For the rest of this page, assume you have already set up your objectives and your options the way they appear here.
Modeling uncertain events
Start with the option "Wait for a better offer". The whole point of waiting is that you do not know exactly what you will get. Say that if you wait, the salary you end up taking could land anywhere from 80K to 120K. Instead of picking one number and pretending you are sure, you can describe that whole range with a probability distribution.
Now think about where the result is most likely to fall. Based on the market and on your own skills and experience, you feel the most likely outcome is somewhere around 100K, and values further from that get less and less likely. That shape, where the middle is most likely and the two ends taper off, is a Normal Distribution, so it fits this situation well.
To set it up, check the Uncertain checkbox for Salary in the "Wait for a better offer" option. Then click the Probability Distribution button, shown in the screenshot below.
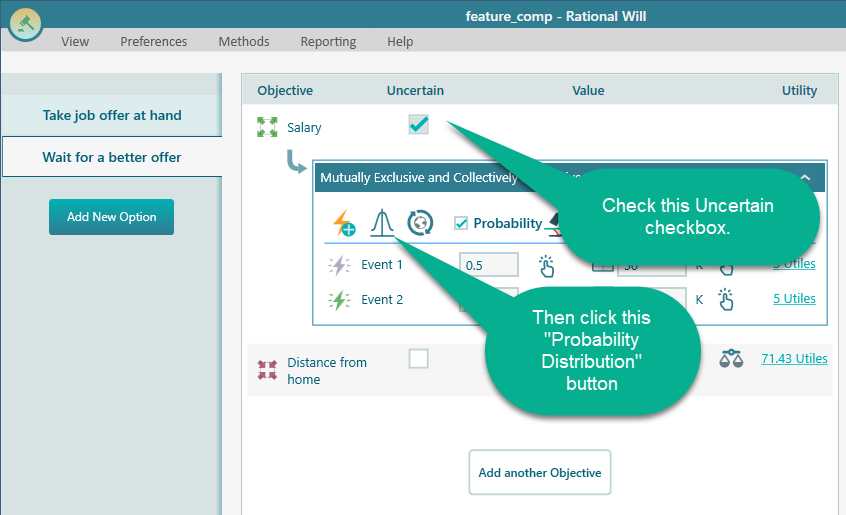
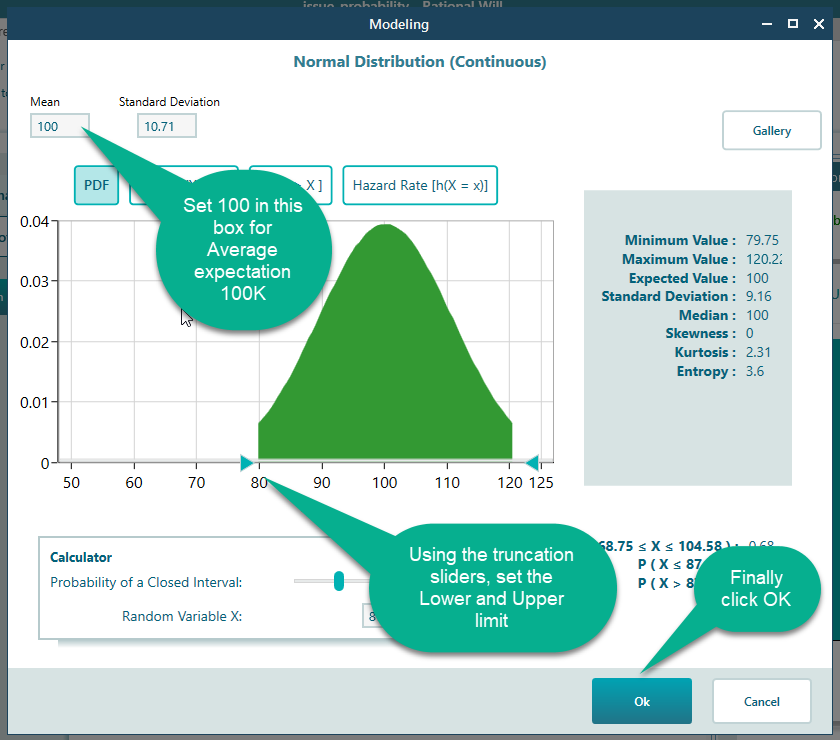
Clicking the Probability Distribution button opens the Probability Distribution dialog. It shows a gallery of distributions you can pick from. Choose the Normal Distribution.
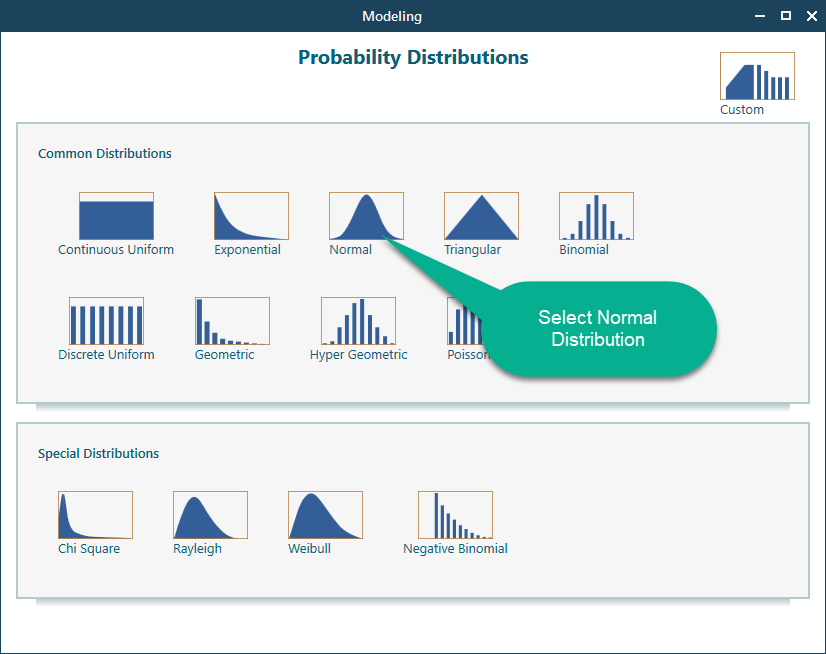
Once you pick the Normal Distribution, it shows up with a range of 50K to 125K, because that is the range you defined earlier in the Objective editor. Now shape it to match what you expect. Set the Mean to 100, since that is your most likely salary. Then drag the Truncation sliders to set the lower and upper limits. These cut off values you do not think are realistic. When the curve looks right, click OK.
After you click OK, the options screen looks like this.
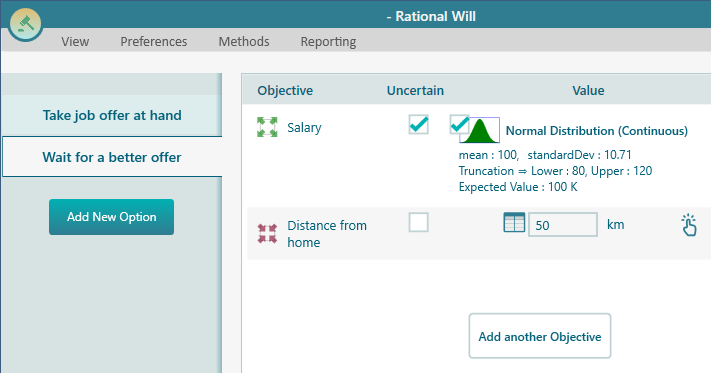
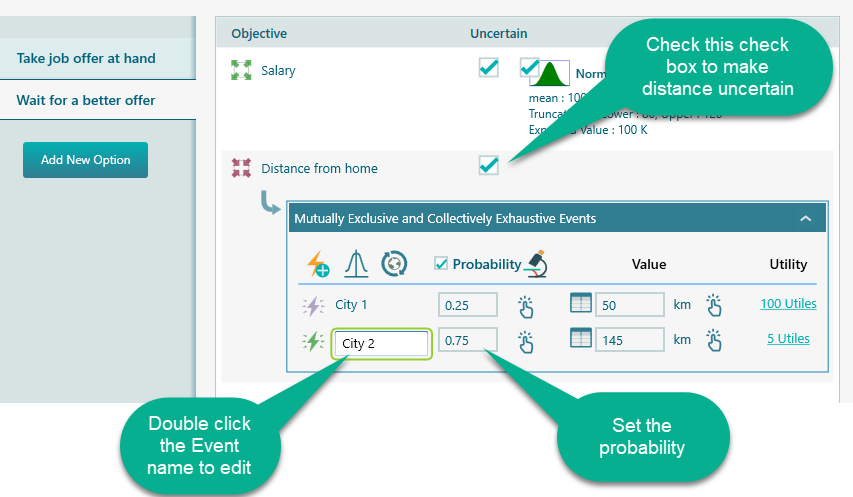
The distance from home carries uncertainty too, but of a different kind. Here you are not dealing with a smooth range of numbers. Instead, the new job lands in one of two specific places. Say it could be in City 1 or City 2. City 1 is 50 km away, and City 2 is 145 km away. So there are just two possible outcomes, each with its own chance of happening.
Let us model those two events. Check the Uncertain checkbox for "Distance from home". Say you believe there is a 75% chance the next job is in City 2. You can type that probability in directly, and the rest of the chance goes to City 1.
Analyze the risk profiles
You have now told the model where the uncertainty sits and how likely each outcome is. The next step is to look at the risk profile of each option and reach a conclusion you can trust. Here is how to read what the analyzer shows you.
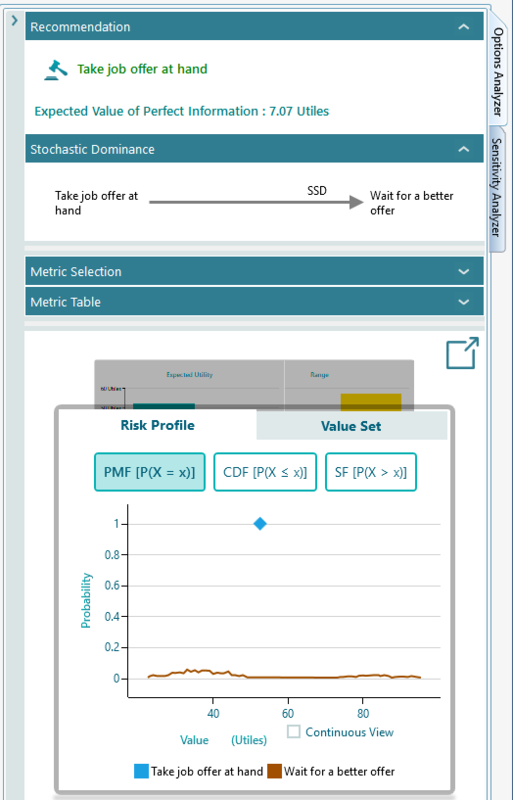
The options analyzer gives you a lot to work with. The Risk Profile chart shows the range of utility values you can reasonably expect from each uncertain option. So you see not just the average result but the spread of what might happen. This chart is built using a Monte Carlo Simulation, which runs the scenario many times over to map out the possible outcomes. Think of it as playing the same decision out thousands of times to see how often each result comes up.
Based on the "Maximize Expected Utility" strategy, the analyzer makes a recommendation for you: "Take the job offer at hand". It also works out the Expected Value of Perfect Information, measured in utiles. That number tells you how much it would be worth to remove the uncertainty for good. It is a handy guide to how much effort or money is worth spending to learn more before you decide. For example, if that value is high, it may pay to call the recruiter and pin down the city before you commit.
The analyzer also works out Stochastic Dominance. In this case, "Take job offer at hand" beats "Wait for a better offer" by Second Order Stochastic Dominance, which means a sensible, risk-aware person should prefer it.
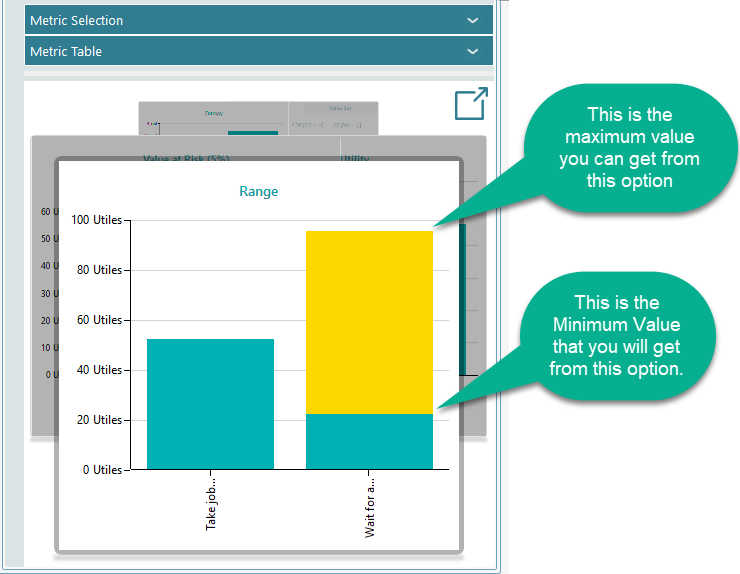
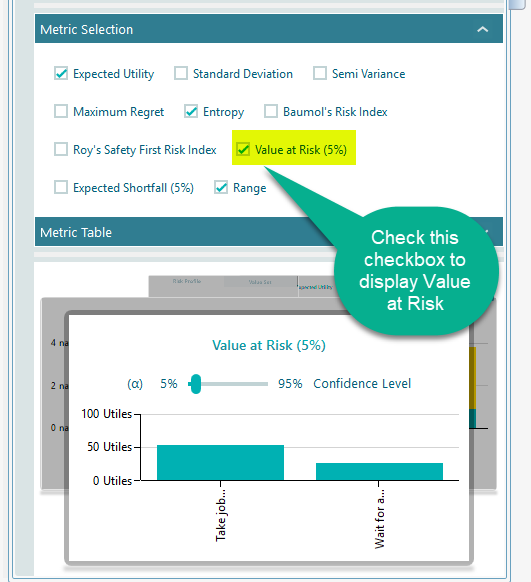
There are many more risk metrics on hand. Expand the "Metric Selection:" panel to turn them on. For example, you can show the Value at Risk metric by checking its checkbox, as shown below.
The carousel lets you look at the same decision from many different angles. One of the most useful views is the Range chart. Notice that "Take job offer" has a single, certain utility value, since there is no uncertainty in it. "Wait for a better offer", on the other hand, stretches across a wide band, from a much lower utility value to a much higher one.
Seeing that range side by side makes the trade-off clear. Waiting could pay off better, but it could also turn out a good deal worse. Taking the offer in hand is steady and predictable. Looking at the spread this way helps you judge how much risk you can really afford, and decide with your eyes open instead of guessing.