


Reporting, Printing and Exporting Diagram
The SpiceLogic decision analysis programs (Rational Will, the Decision Tree software, and others) all come with strong reporting built in. Once your decision model is ready, you can turn it into a report with one click. Save it as a PDF, or as an Excel file if you would rather work with the numbers in a spreadsheet. You can also copy just the diagram image straight to the clipboard and paste it into another program like MS Word or Paint, or save the diagram as a JPG, PNG, or BMP file.
The idea is simple. You do the thinking in the software, and the software hands you something clean to share. Say you spent an afternoon building a tree to decide whether to lease or buy a delivery van. Your manager does not want to open the software and poke around. She wants a tidy page she can read in two minutes. That is what the report is for. It works for a boss, a client, a teacher, or your own future self six months from now when you have forgotten the details. Below we walk through each option, one at a time.
PDF Report
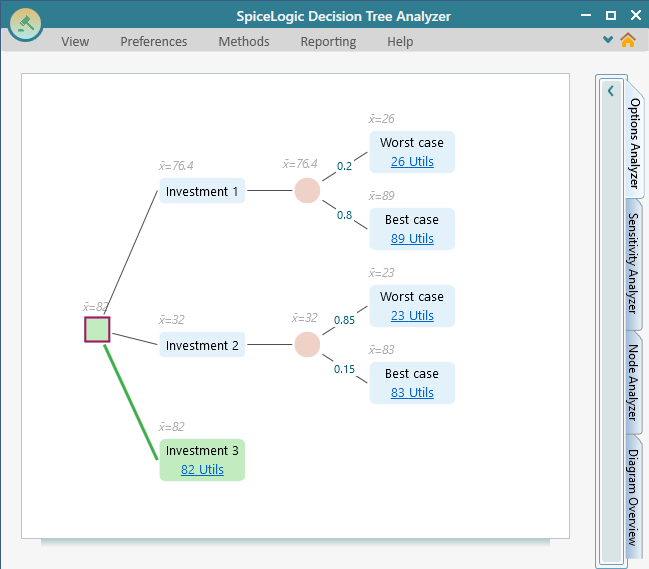
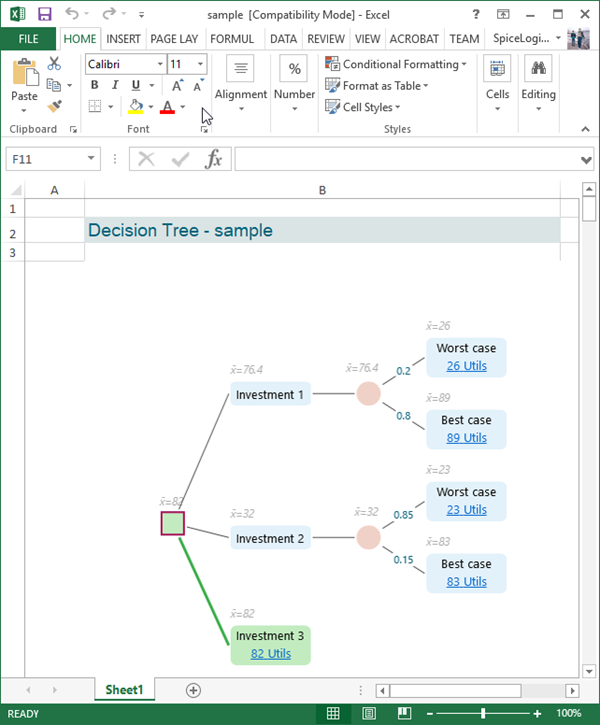
Let us say you have built a decision tree like the one below.
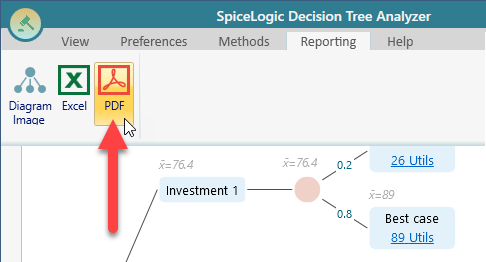
To create the report, open the Reporting menu on the ribbon and click PDF, as shown here.
As soon as you click the PDF button, the software builds the report and shows it to you, like the screenshot below. The images on this web page have been shrunk to fit, so they may look a little blurry here. In the real report they are crisp and clear.
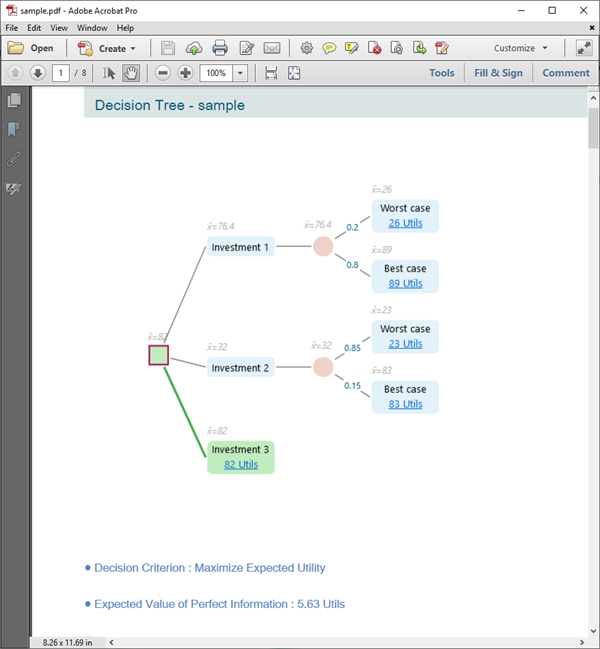
The report holds everything that matters: the analysis, the parameters you entered, and the results. Nothing is left out. So the reader can follow your reasoning from the first node all the way to the recommended choice, without having to ask you what each number means. If you handed the PDF to someone who never saw your screen, they would still understand how you reached the answer.
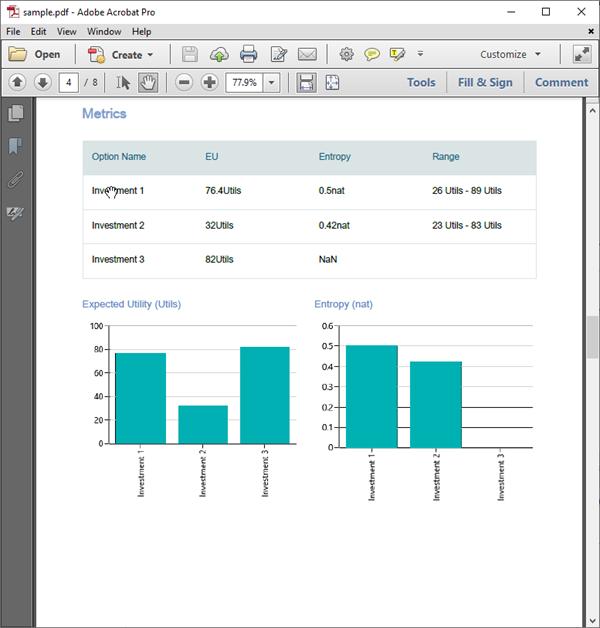
All the metrics, the sensitivity analysis, and the charts are carried over into the report as well. So whatever you can see on screen ends up in the document. Nothing useful gets dropped on the way out. For example, if your sensitivity analysis shows that the decision flips once the fuel cost passes a certain point, that same chart sits right there in the PDF for your reader to see.
Excel Report
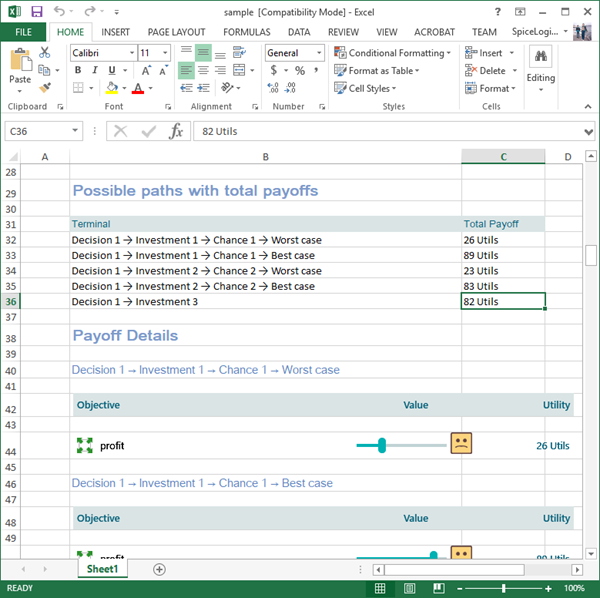
You can also get the same report as an Excel file. It works just like the PDF: open the Reporting menu shown earlier and pick Excel instead. This is handy when you want to keep working with the figures. You can sort them, change a number to test a what-if, or drop them into your own spreadsheet next to other data. A finance person who lives in Excel all day will thank you for this one.
Export the Diagram Image
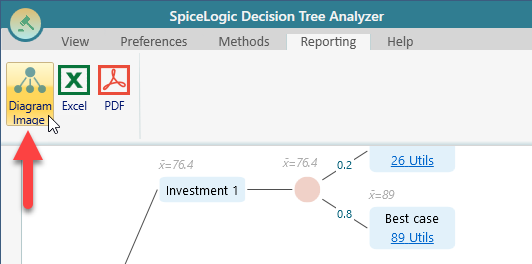
Sometimes you do not need a full report. You just want the picture of the diagram, maybe to drop into an email or a slide. You can export only the diagram image. There is a Diagram Image option for this in the Reporting menu on the ribbon.
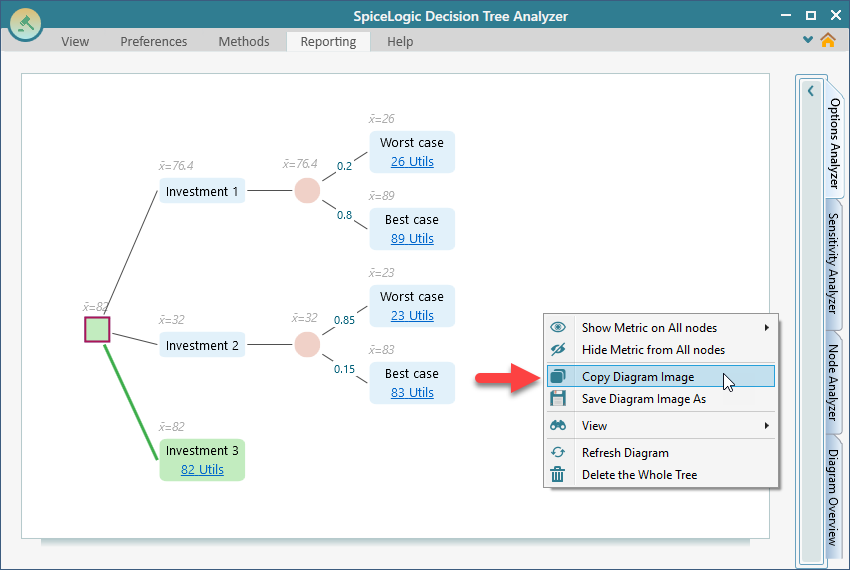
Because people export the diagram so often, there is more than one way to do it. The quickest way is to right-click anywhere on the diagram to bring up its menu. From there you can copy the image to the clipboard and paste it straight into another program such as MS Word or Microsoft Paint. No saving a file, no hunting through folders. Copy, switch windows, paste, done.
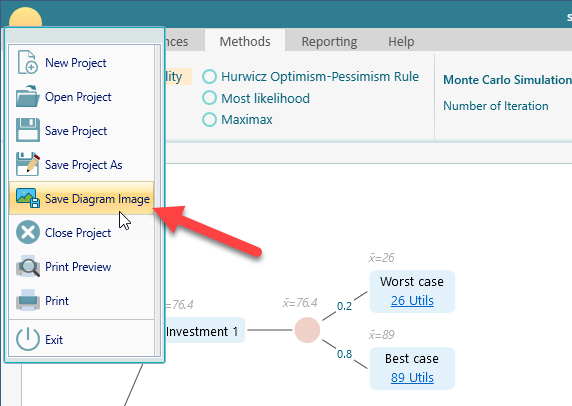
In that same right-click menu, you will also see a "Save Diagram Image As" option. Click it to save the diagram as an image file on your computer. The same save option is also there in the Reporting section of the ribbon, so use whichever is closer to hand. If your mouse is already on the diagram, the right-click menu is faster. If you are working up in the ribbon, just stay there.
On top of that, you can reach the diagram export option from the main Application menu as well. So whether you prefer the right-click menu, the ribbon, or the Application menu, you can always get to it. The point is that you never have to remember one special spot. Pick the route that feels natural and the image comes out the same.
Print and Print Preview
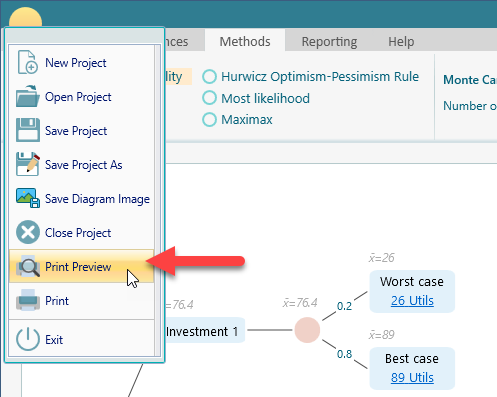
You can print your decision model straight from the program. Open the Application menu and choose Print to send it to your printer. Or choose Print Preview first if you want to see how it will look on paper before you commit. Print Preview is the safe habit. It lets you catch a page that runs off the edge before you waste paper and ink on it.
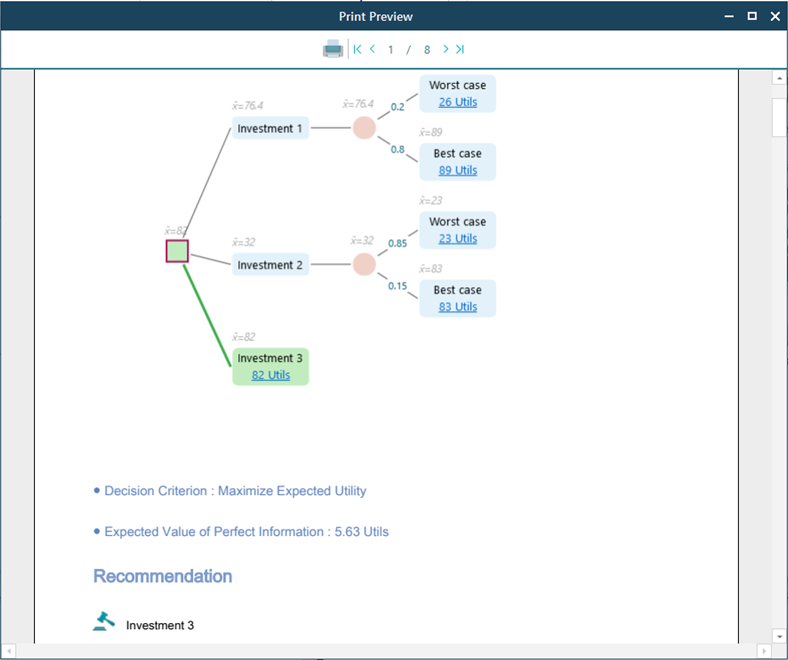
When you click Print Preview, a preview window opens up. Behind the scenes, the software builds a PDF report and shows that PDF inside the preview window. So what you see there is exactly what will print. There are no surprises between the preview and the paper.
If you run into a problem
When you open the Print Preview window, you might see the message below instead of the preview.
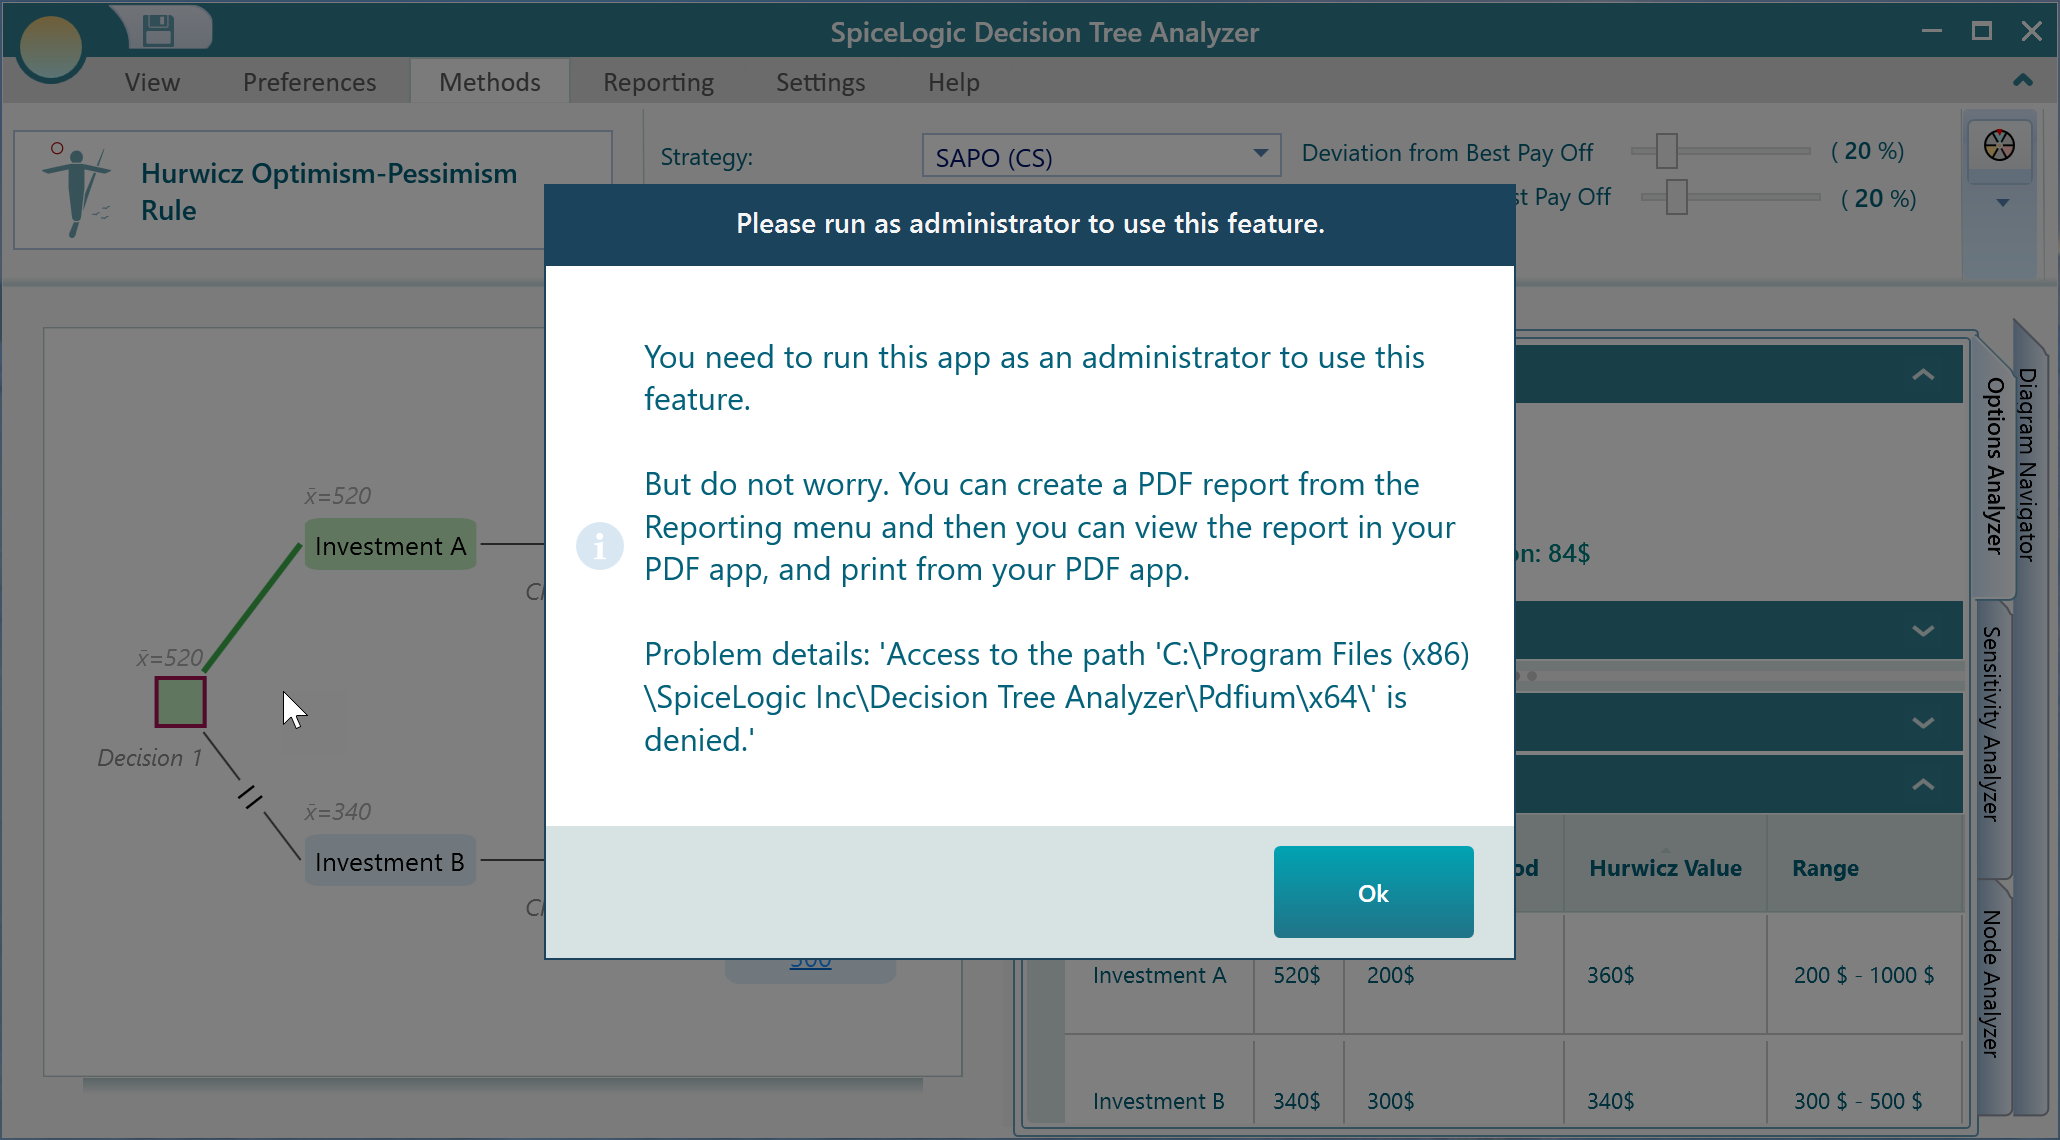
If you hit this, the fix is simple. Close the program and run it as Administrator, then try again. The print preview feature needs a bit of extra permission, and that permission is only granted when the program runs as Administrator. To run as Administrator, right-click the program icon and choose "Run as administrator". And if you cannot or would rather not run as Administrator, do not worry. Just create a PDF report instead, open that PDF in your usual PDF viewer, and print it from there. You end up with the same printout either way.