


QALY and Cost with Markov Model
Let's work through a real example so you can see how this fits together. Picture a group of 100,000 people. Over time, each person moves between four health states: Well, Recurrence, Dead, and Dying by disease. We want two answers about this group. First, how long do they live on average? Second, how much does their care cost on average?
To answer that, we need to know how people move from one state to the next in each cycle. Those chances are called transition probabilities. For example, a person who is Well this year might stay Well next year, or slip into Recurrence. We set up all of those chances as shown below.
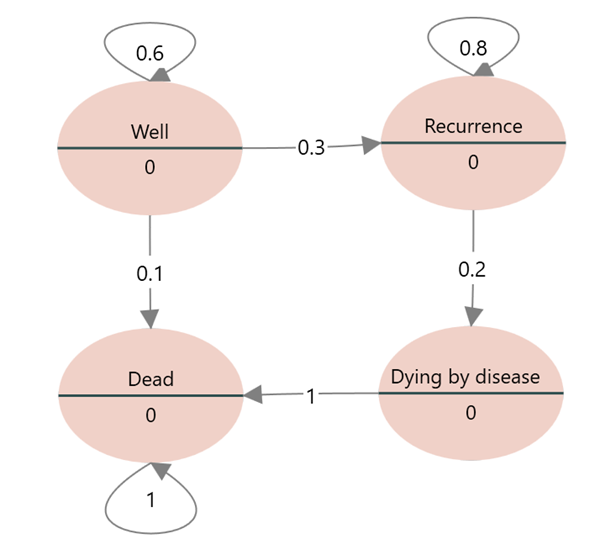
Next we need the payoffs for each state. Every year a person spends in the Well state or the Recurrence state counts as 1 life year gained. A year in Well costs $350. A year in Recurrence costs $3,190. Dying by disease costs $1,400. The Dead state has no cost at all.
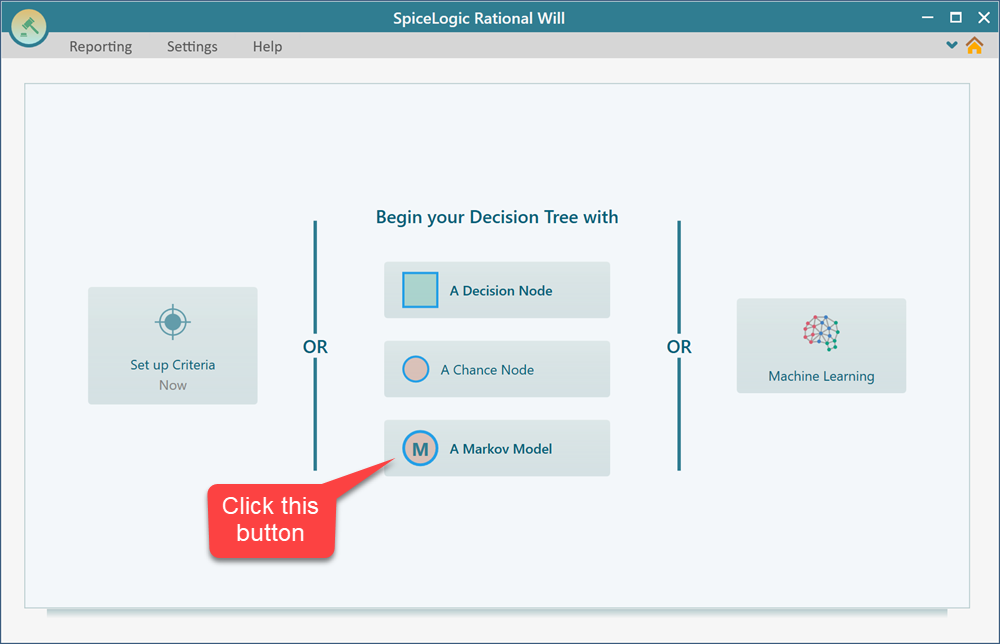
Now we have the states, the transition probabilities, and the payoffs. That is everything the model needs to work out the life expectancy of this group and its expected cost. To get started, open Rational Will or SpiceLogic Decision Tree and click the Markov Model button.
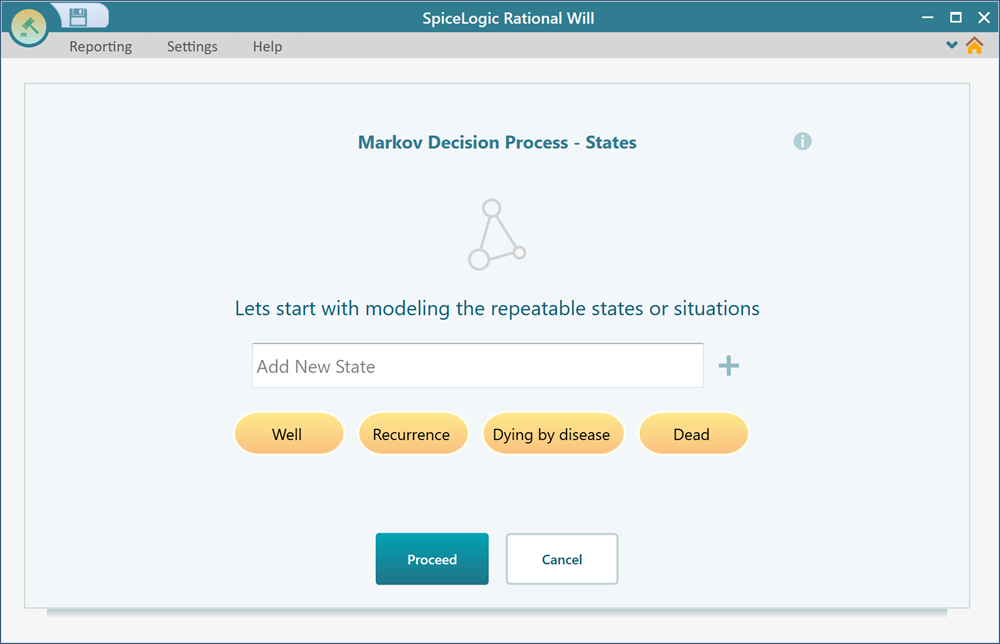
Step 1: Specifying the states
When you click the Markov Model button, a wizard opens. It walks you through the setup one screen at a time, so you never have to guess what comes next. On the first screen, add the four states from our example: Well, Recurrence, Dying by disease, and Dead. The screen below shows all four added.
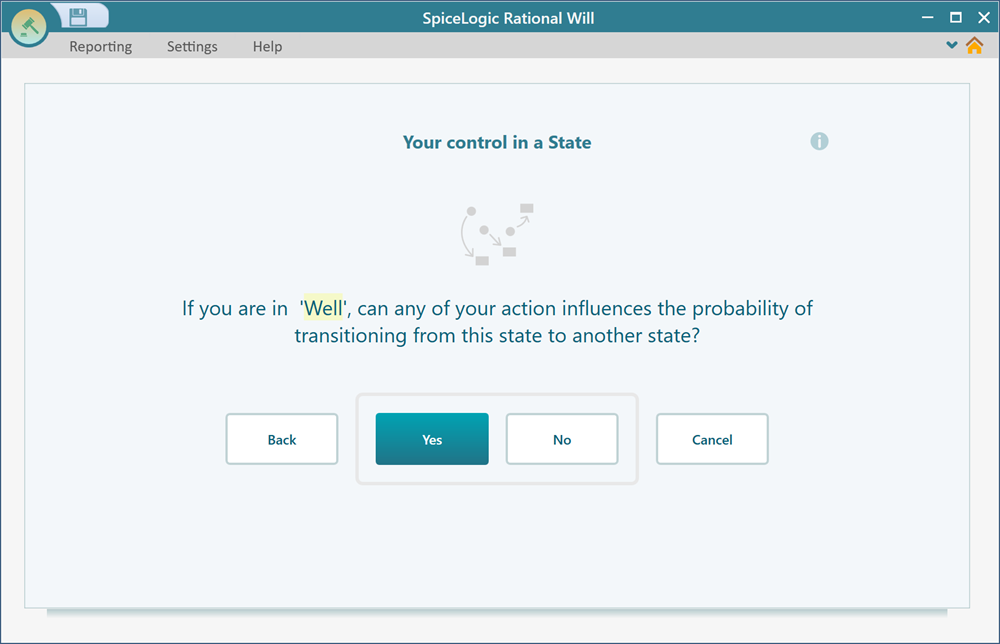
Now click Proceed. The next screen asks whether any state has an action you can take from it. In this example there are no decisions to make. The group just moves between health states on its own. So answer No and click Proceed again.
Step 2: Configuring the cohort simulation settings
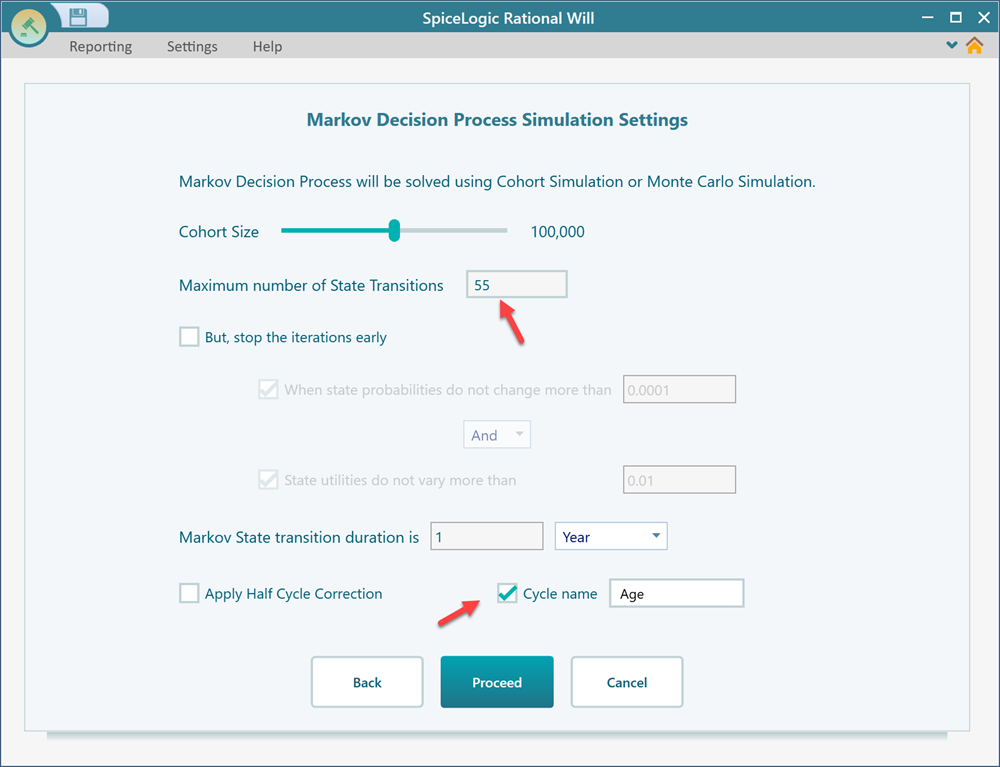
The wizard now asks you to set the simulation settings for the Markov process. Match the settings shown below. The one that matters most is the maximum number of state iterations. Set it to 55. Each iteration is one cycle, which here is one year. So 55 iterations runs the group forward for 55 years. That is long enough for almost everyone to reach the Dead state and for the numbers to settle down.
Step 3: Setting up the transition probabilities
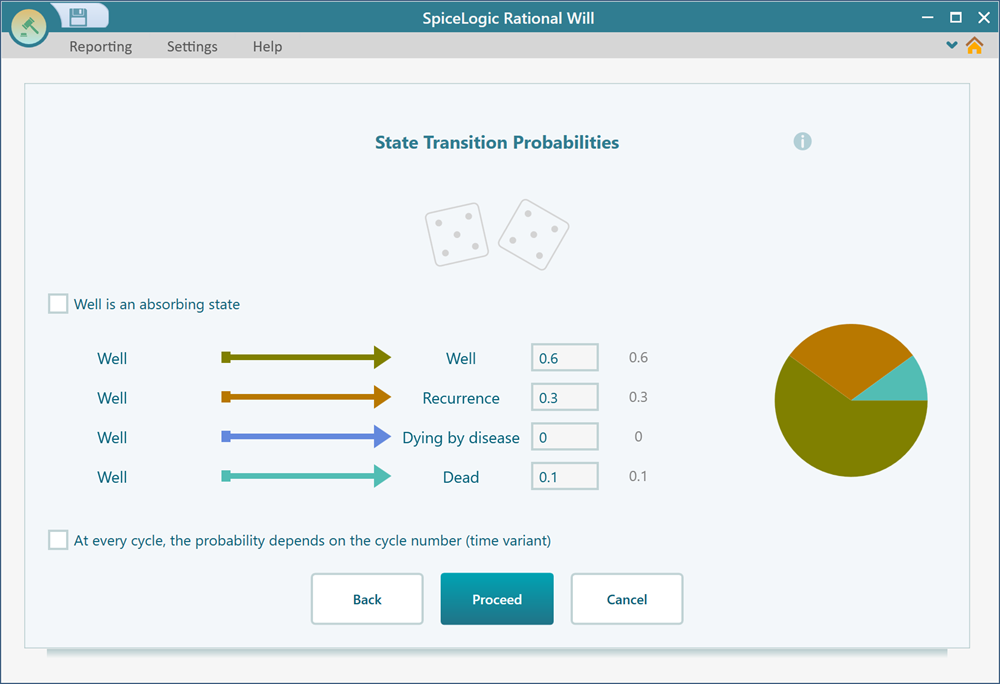
Click Proceed and the wizard asks for the transition probabilities. These are the chances of moving from one state to another in a single cycle. Start with the Well state. Set the chance of staying in Well, and the chances of moving to each of the other states, exactly as shown below. The probabilities for one state always add up to 1, so if they do not, check your numbers before moving on. When you are done, click Proceed.
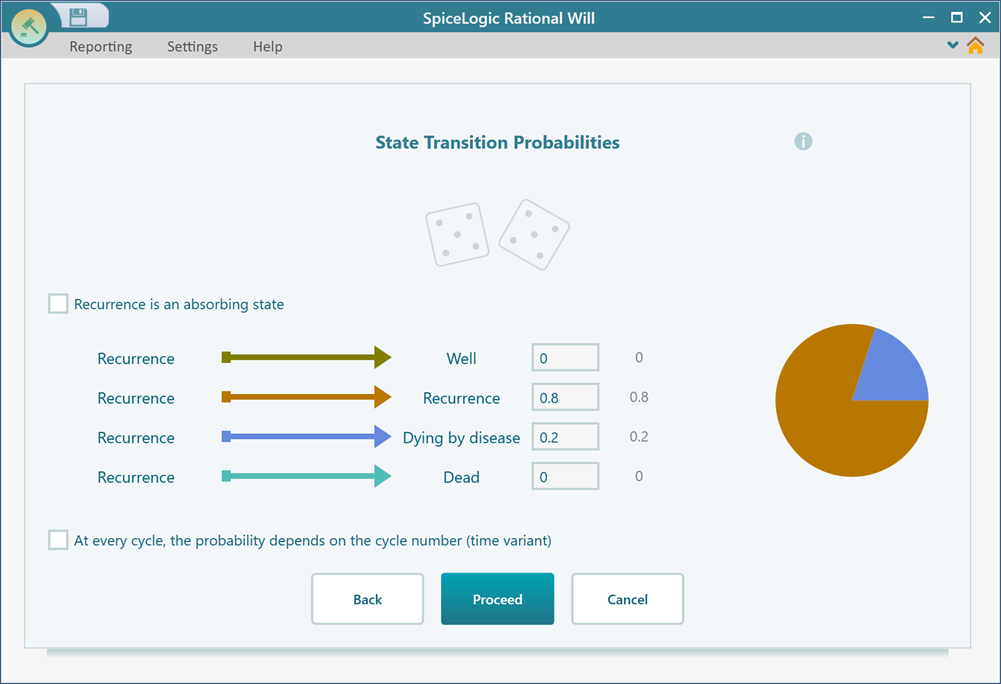
The next screen asks for the transition probabilities of another state, the Recurrence state. Fill them in as shown below.
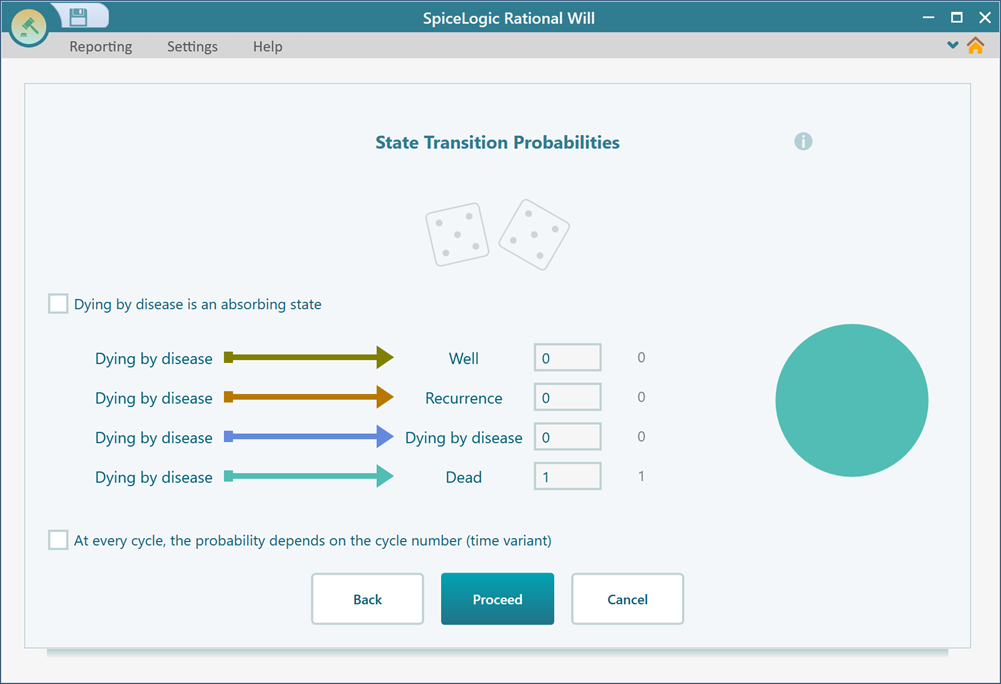
Click Proceed. Now the wizard asks for the transition probabilities of the Dying by disease state. Set them as shown, then click Proceed again.
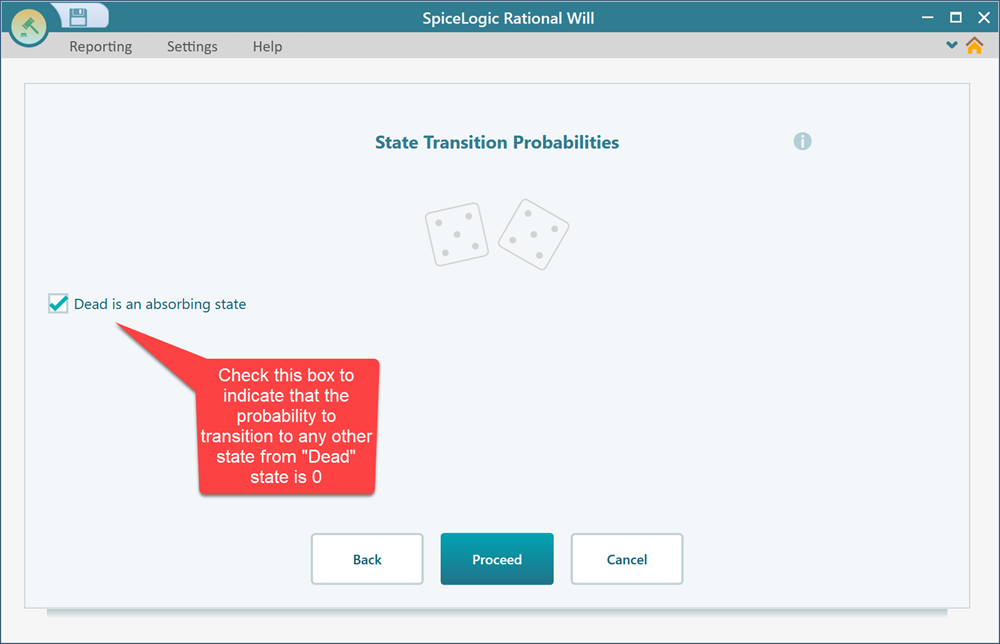
Finally, mark the Dead state as an absorbing state. An absorbing state is one nobody ever leaves. Once a person is dead, they stay dead for the rest of the simulation. Marking it tells the model that no transitions lead out of this state. Then click Proceed.
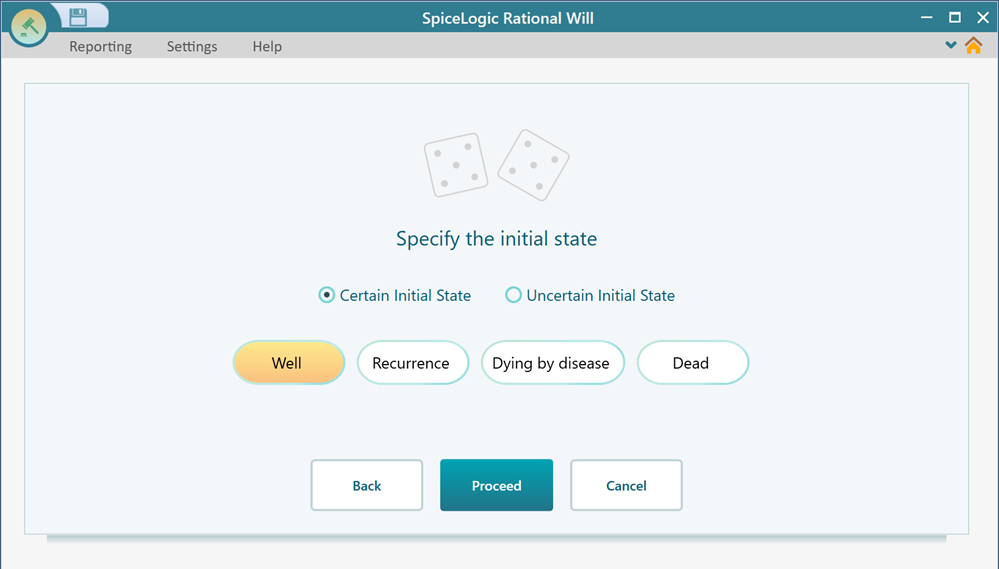
Step 4: Specifying the initial state
The wizard now takes you to a screen where you pick the starting state. This is the state everyone in the group begins in. For this example, choose Well as the initial state, since all 100,000 people start out healthy.
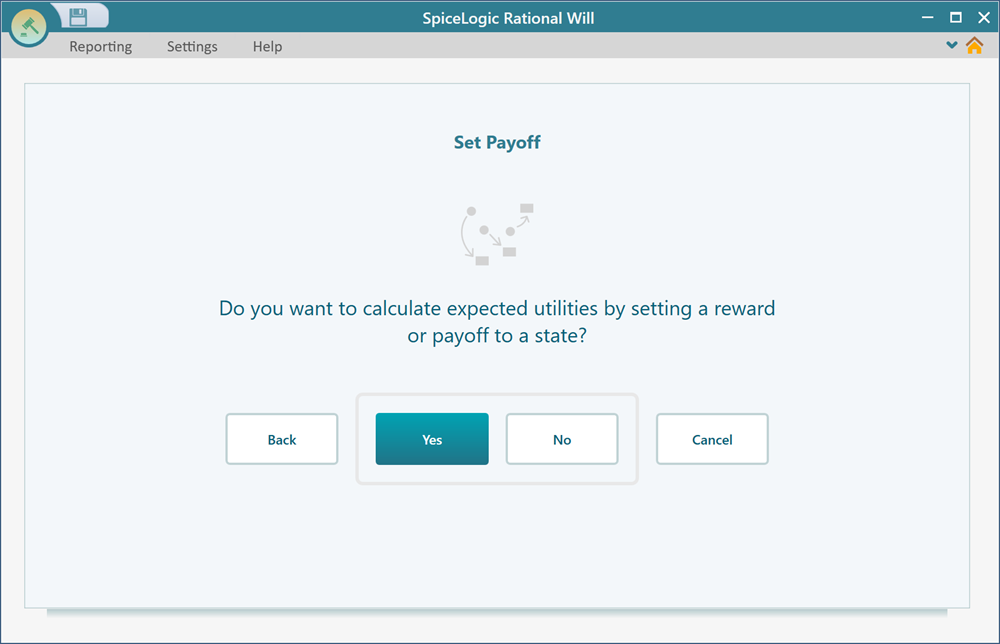
Step 5: Setting the payoff
Now it is time to tell the model what each state is worth, both in life years and in cost. On the next screen, click Yes to start setting the payoffs.
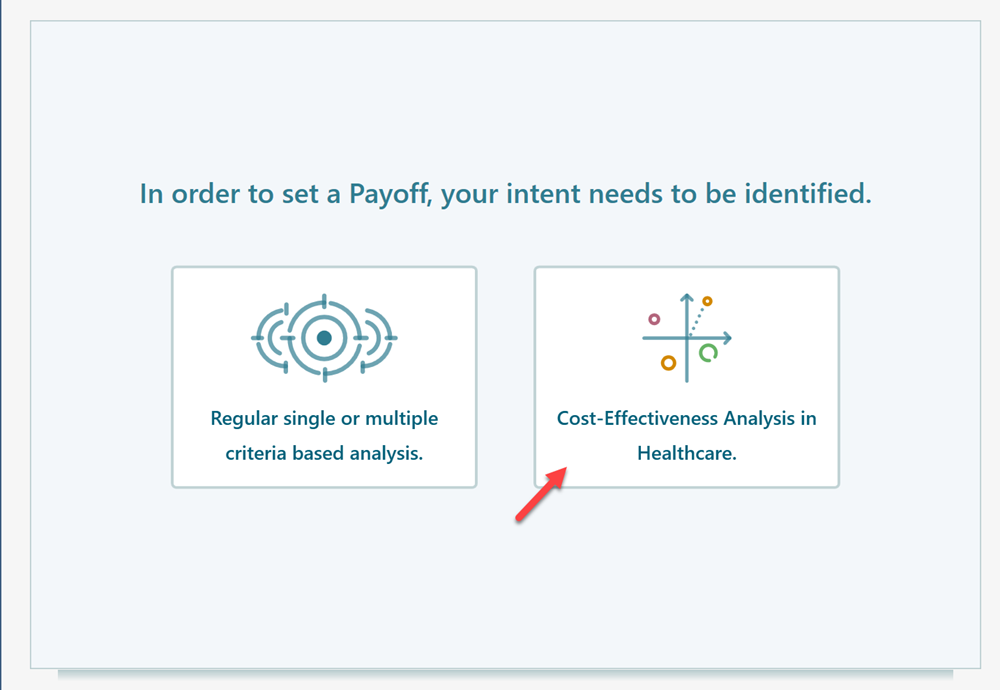
On the screen that follows, click the Cost-Effectiveness Analysis in Healthcare button. This tells the model you want to track two things side by side: how effective each state is, measured in life years, and how much it costs.
Next, set the effectiveness criterion as shown below. This is the benefit we care about, the life years gained.
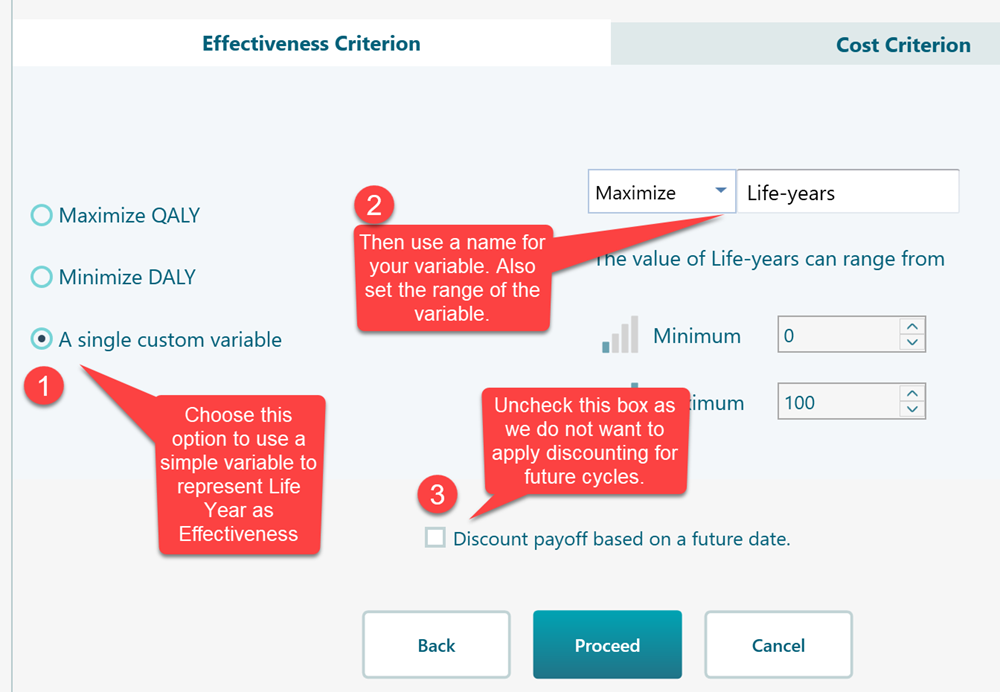
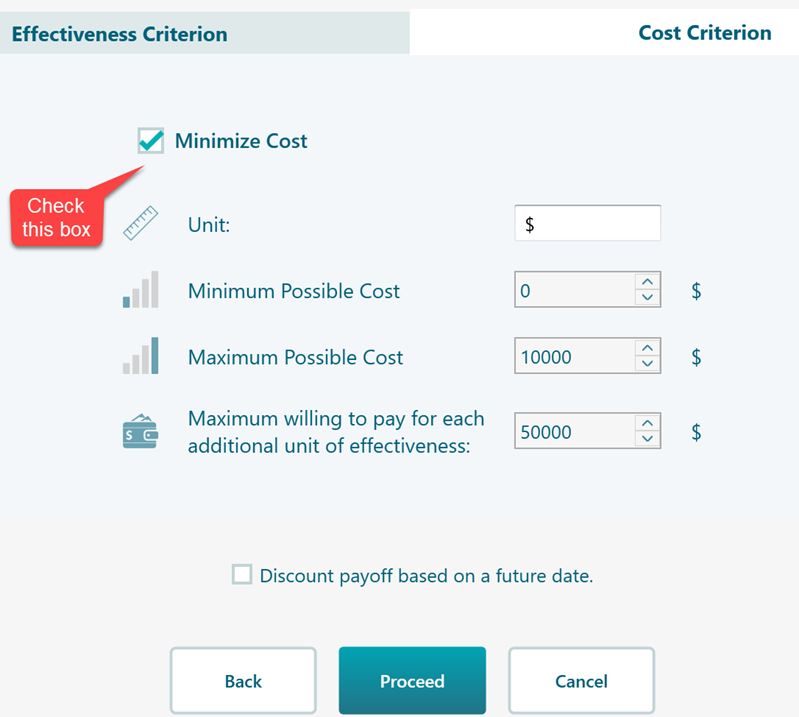
Now click the Cost tab at the top and check the box as shown below. This turns on cost tracking alongside the effectiveness you just set.
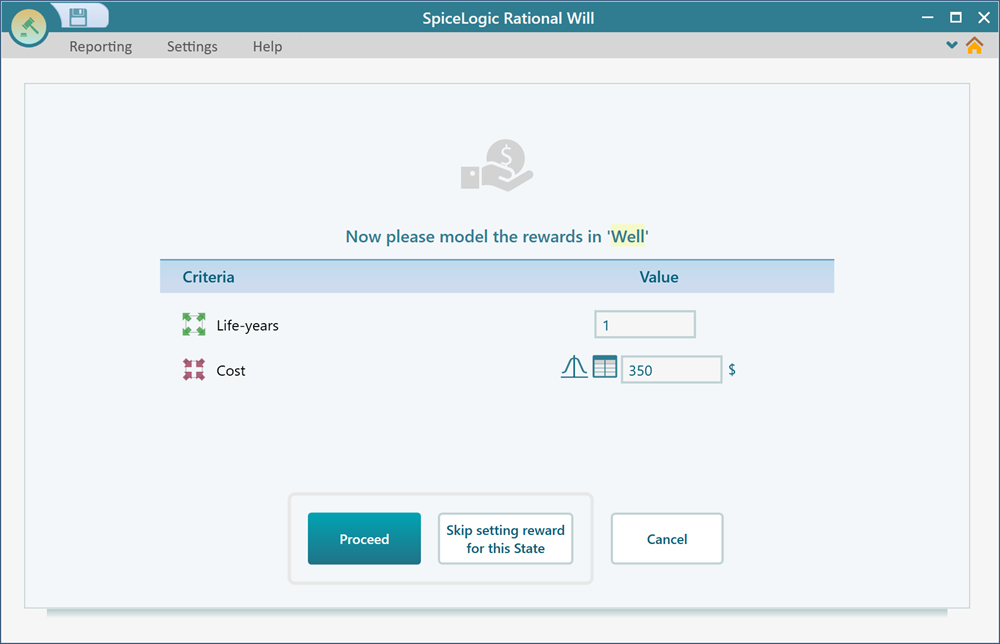
Click Proceed. The wizard asks you to set the cost and effectiveness for the Well state. Set Life-years = 1, because each cycle spent in Well adds one life year. Set the cost to $350, the cost of one year in that state.
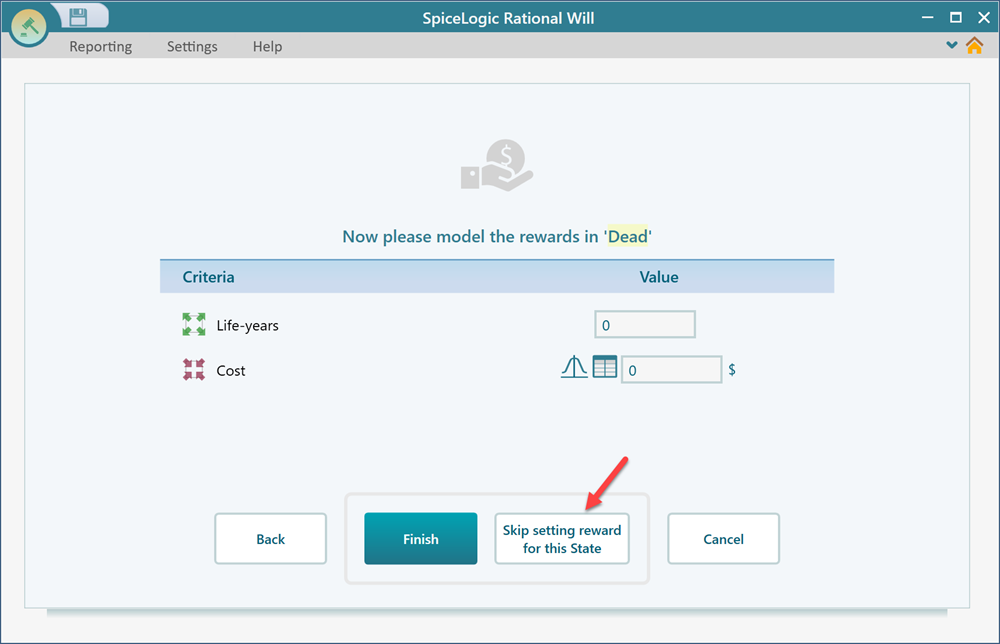
Click Proceed. For the Recurrence state, set 1 life year and a cost of $3,190, then click Proceed. For the Dying by disease state, set 0 life years and a cost of $1,400, then click Proceed. The Dead state has no cost and no life years, so there is nothing to enter. Just click the Skip setting reward for this state button.
As soon as you click that button, the wizard finishes and your model appears as a decision tree diagram.
Step 6: Analyzing the result
Now open the Markov Analyzer panel to see what the model worked out.
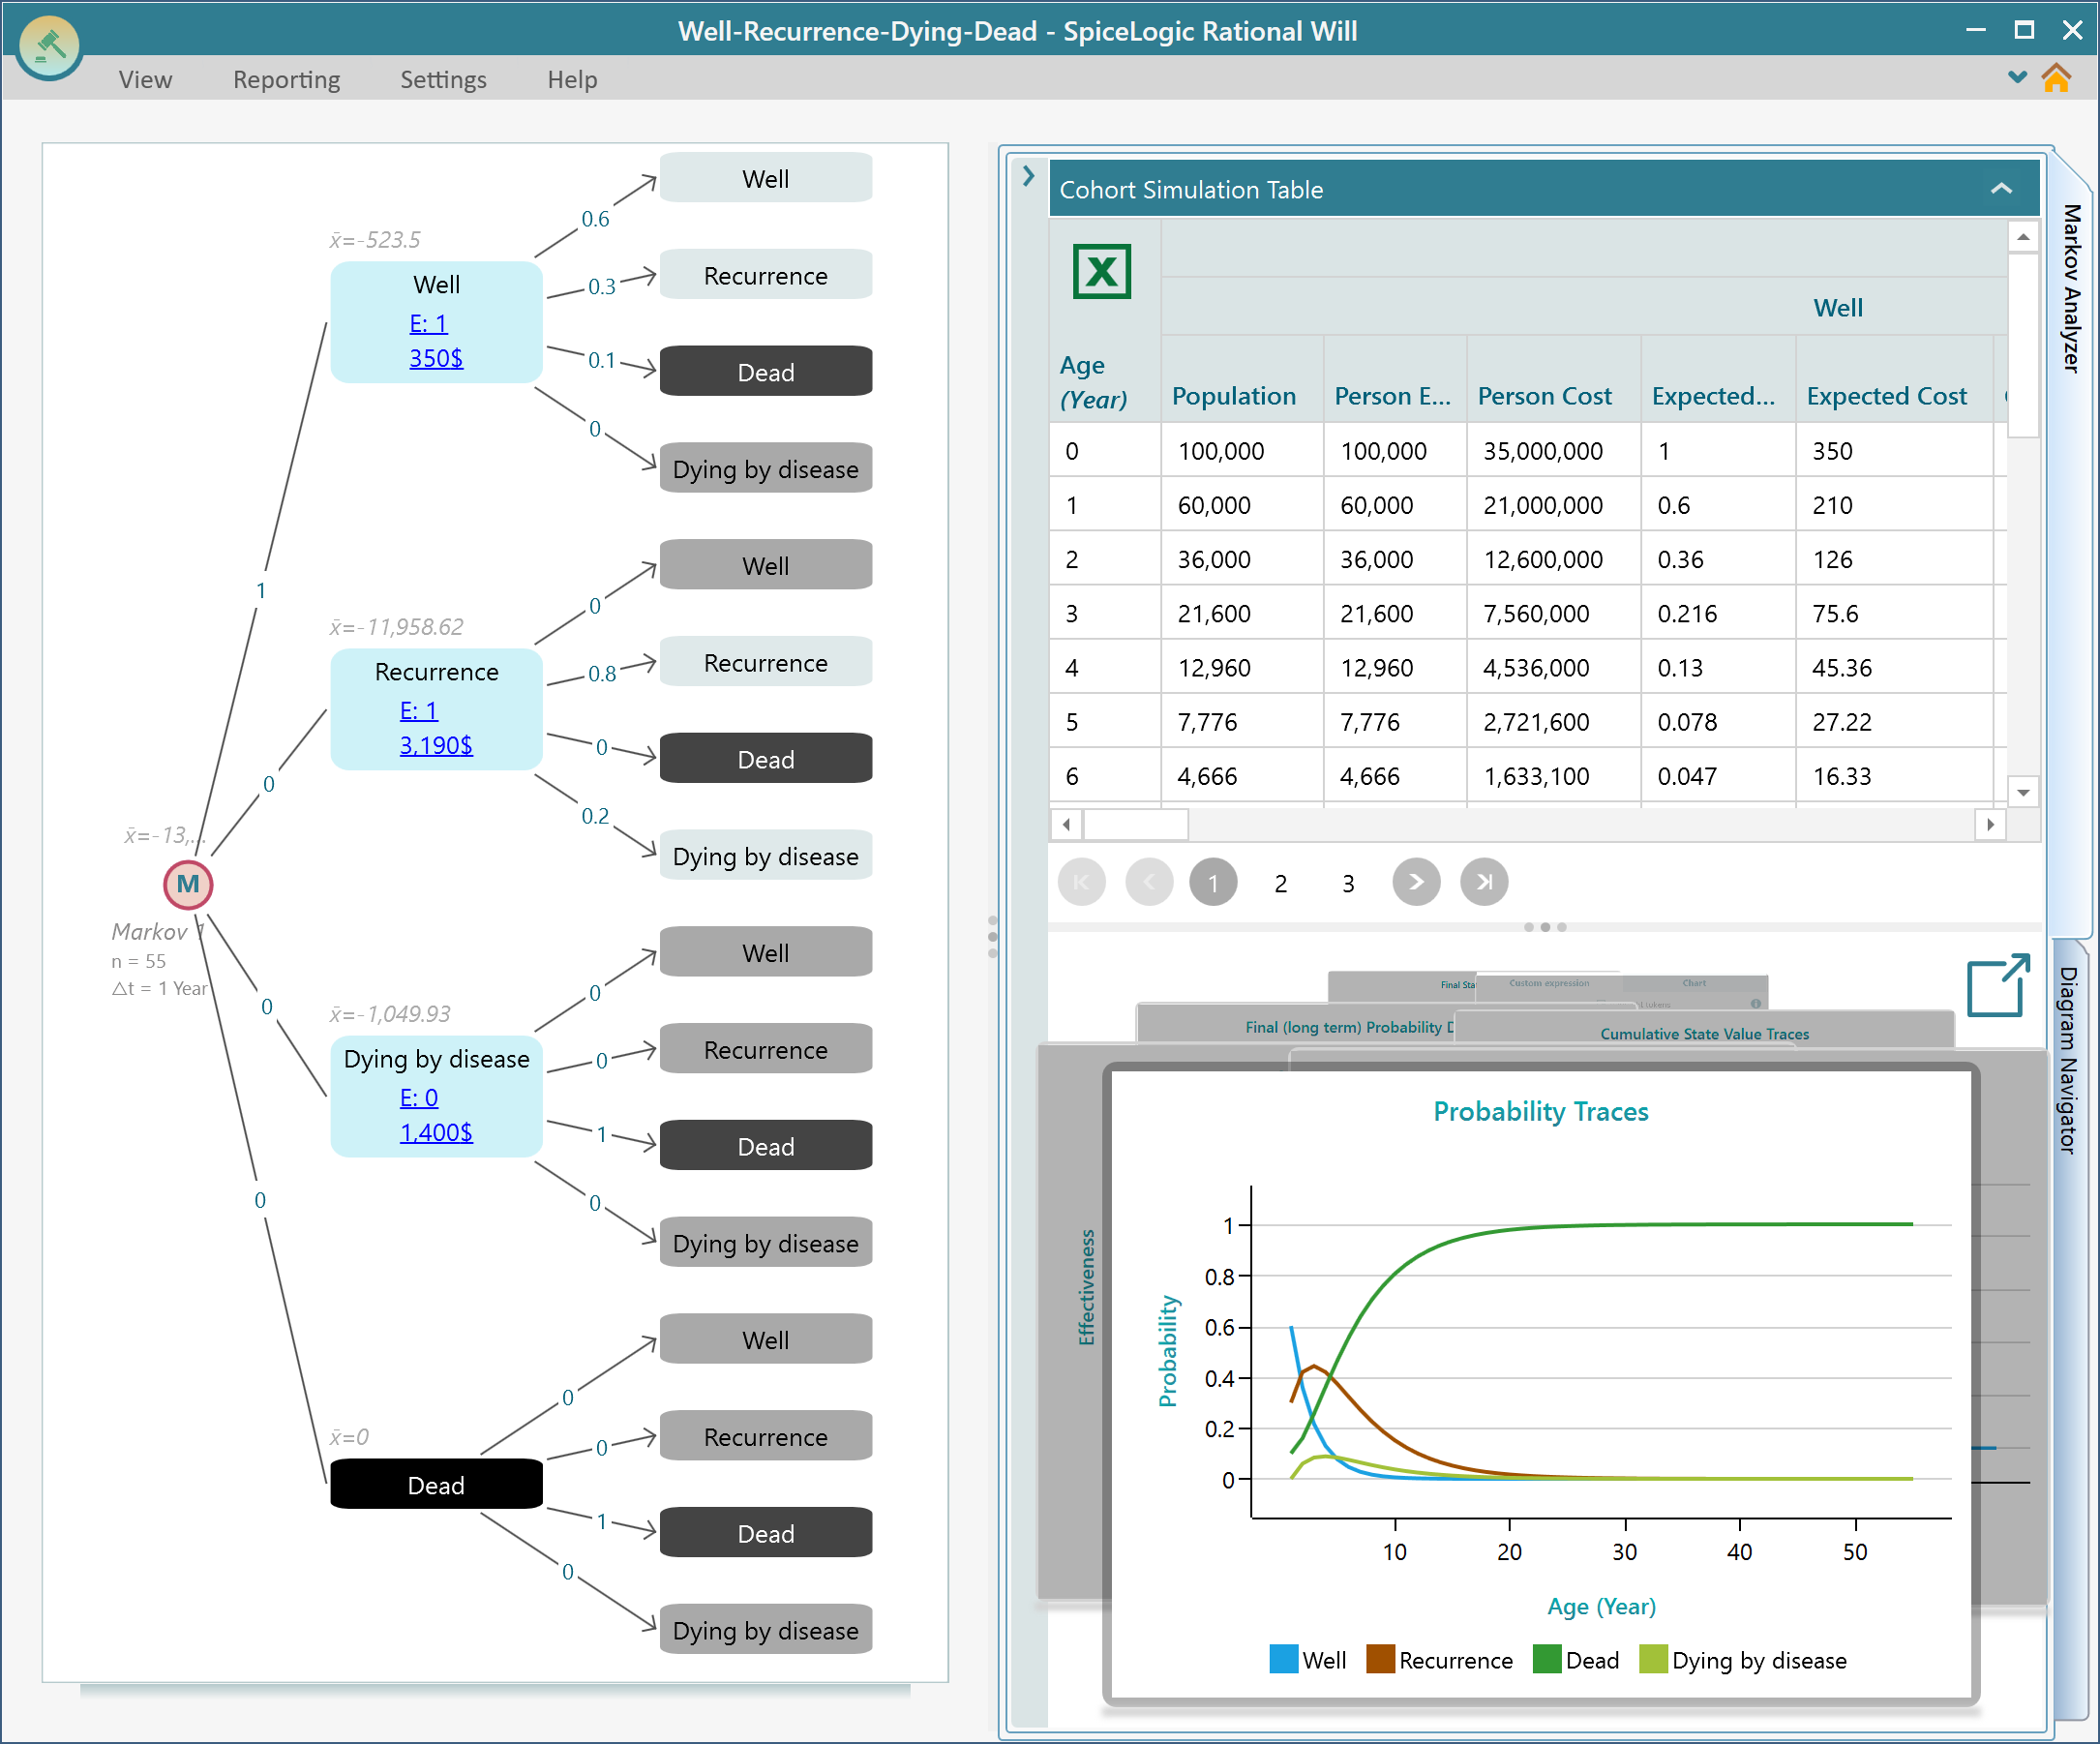
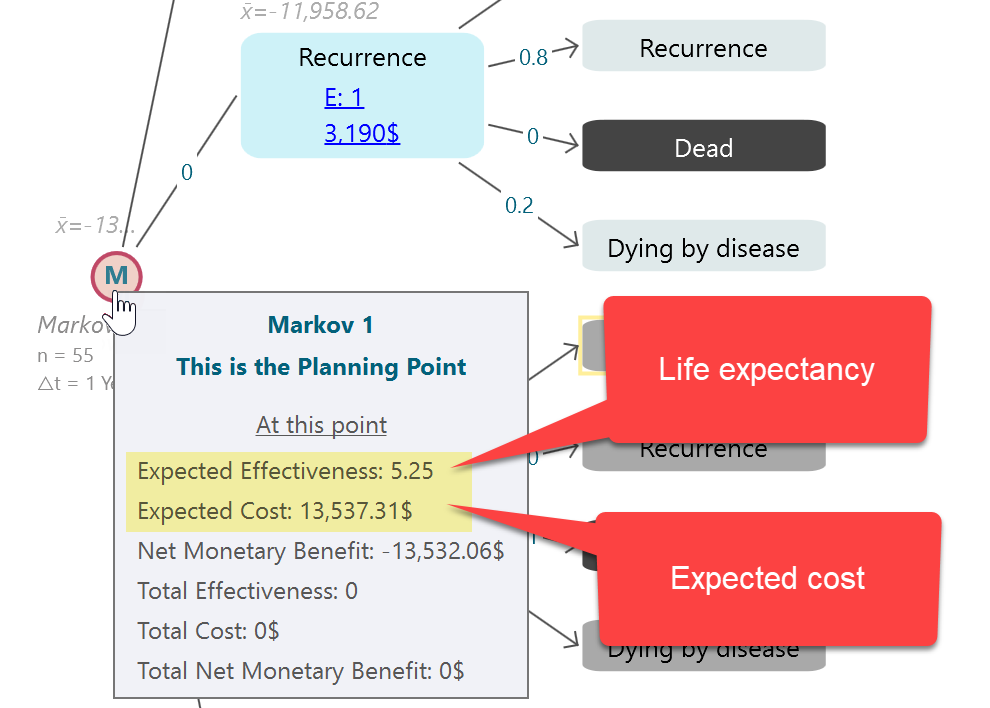
To read the two answers we wanted, hover over the Markov chance node. Its tooltip shows the life expectancy and the expected cost for this group, as shown below.
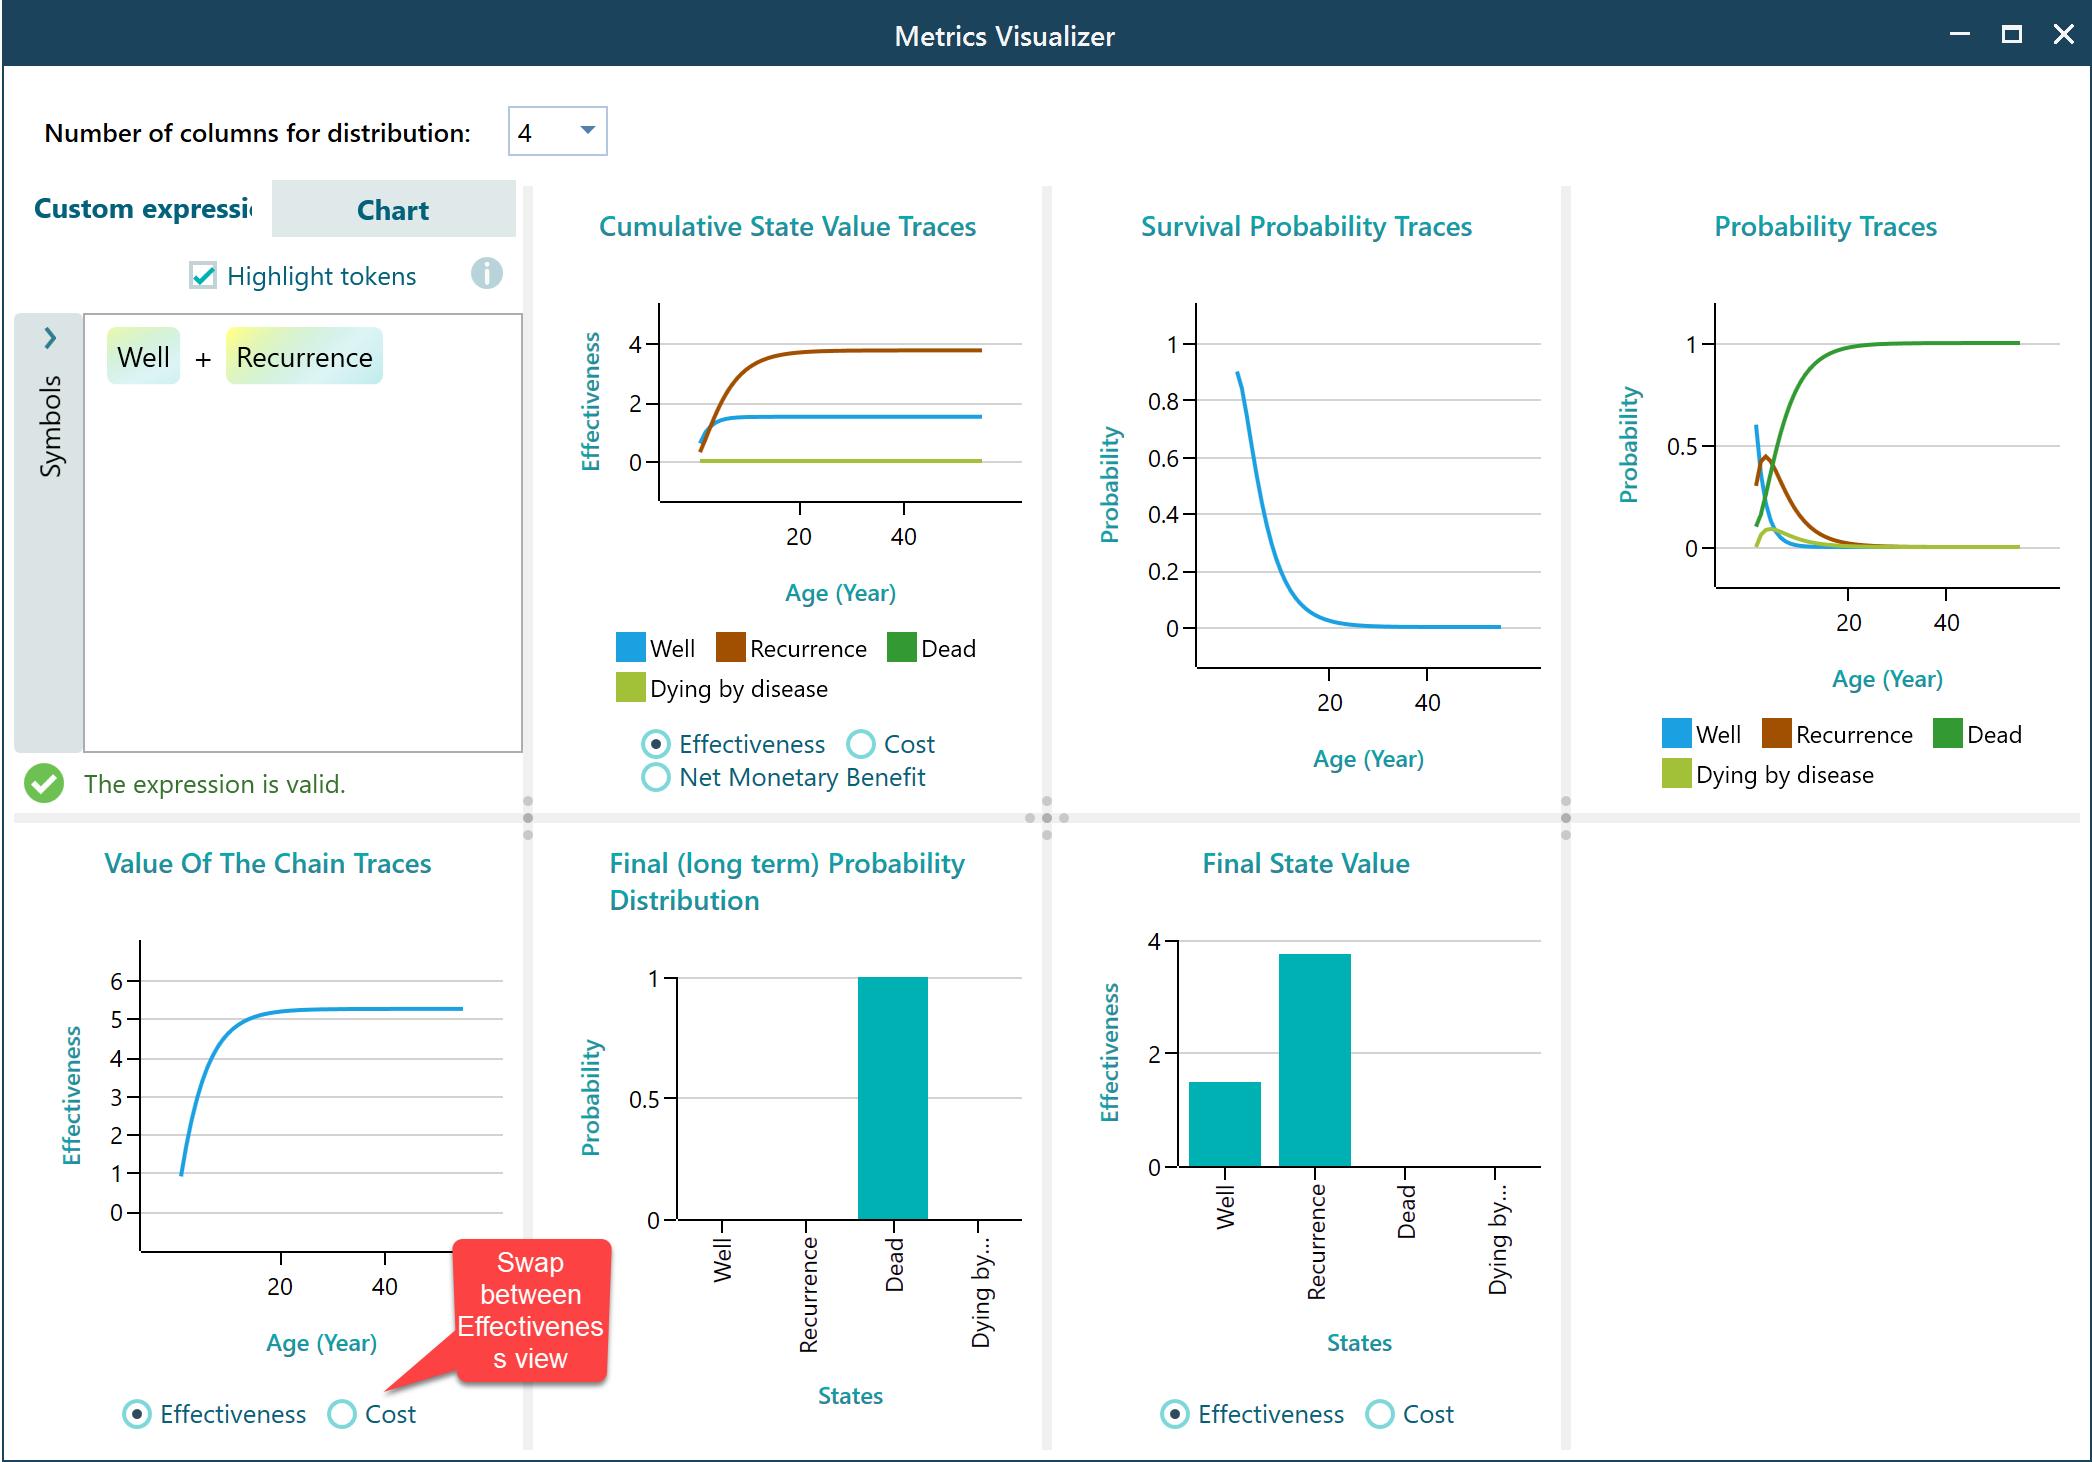
You can also open the charts to look at the Markov model from other angles. For example, you can see how the group spreads across the states over time, and how cost builds up cycle by cycle.
Step 7: Modifying and refining the model
Once the wizard is done, you are left with the decision tree showing the Markov process diagram. Nothing is locked in. You can go back and change the states, the transition probabilities, the rewards, or anything else, and the results update to match. Say a new study comes out with better survival numbers. Just update the transition probabilities and read the new life expectancy right away. To learn how to edit the diagram directly, see this page.