Decision Tree Machine Learning
The SpiceLogic Decision Tree software does two different jobs. You can build your own decision tree to make a sound, rational choice. You can also go the other way and learn how other people made their choices, by looking at the data they left behind. That second job is called Decision Tree Machine Learning.
It helps to know the difference between two ways of thinking about decisions. Normative decision theory is about how a rational person should decide. Descriptive decision theory is about how people actually decide, whether those choices were smart or not. Machine learning sits on the descriptive side. You feed it real records of what people did, and it works backward to find the pattern behind their behavior. In plain terms, it is a way to read people's minds from their actions.
Here is a quick example of the difference. Say you want to know which loan applications a bank should approve. The normative way is to sit down and reason out the rules a careful lender would follow. The descriptive way is to take a stack of past applications, look at which ones the bank actually approved, and let the software find the pattern. You end up with the bank's real policy, even the parts nobody wrote down.
The SpiceLogic Decision Tree software supports both ways of working. With machine learning, it can study your data and build two kinds of trees for you: a Classification Decision Tree and a Regression Tree. The pages below walk through each one with a worked example.
Classification Decision Tree
A classification tree predicts a category. The answer it gives back is a label, like Yes or No, or Low, Medium and High, rather than a number.
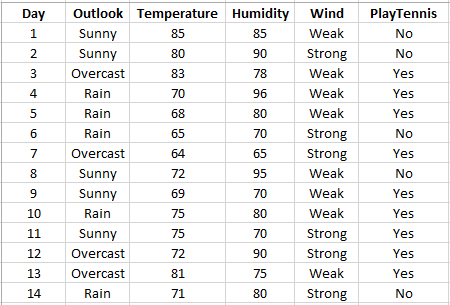
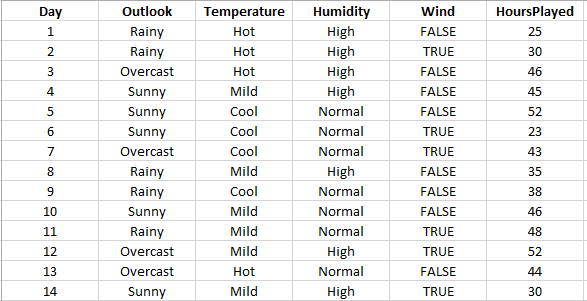
Here is a simple example. Imagine you want to sell hot dogs next to a tennis court, where the players are your main customers. The trouble is that the players do not show up every day, so some days you sell nothing. To figure out what brings them out, you start writing down the weather for each day: the outlook (sunny, overcast, rainy), the temperature, the wind, the humidity, and whether the players actually came out and played. After a few weeks your notes look like the table below.
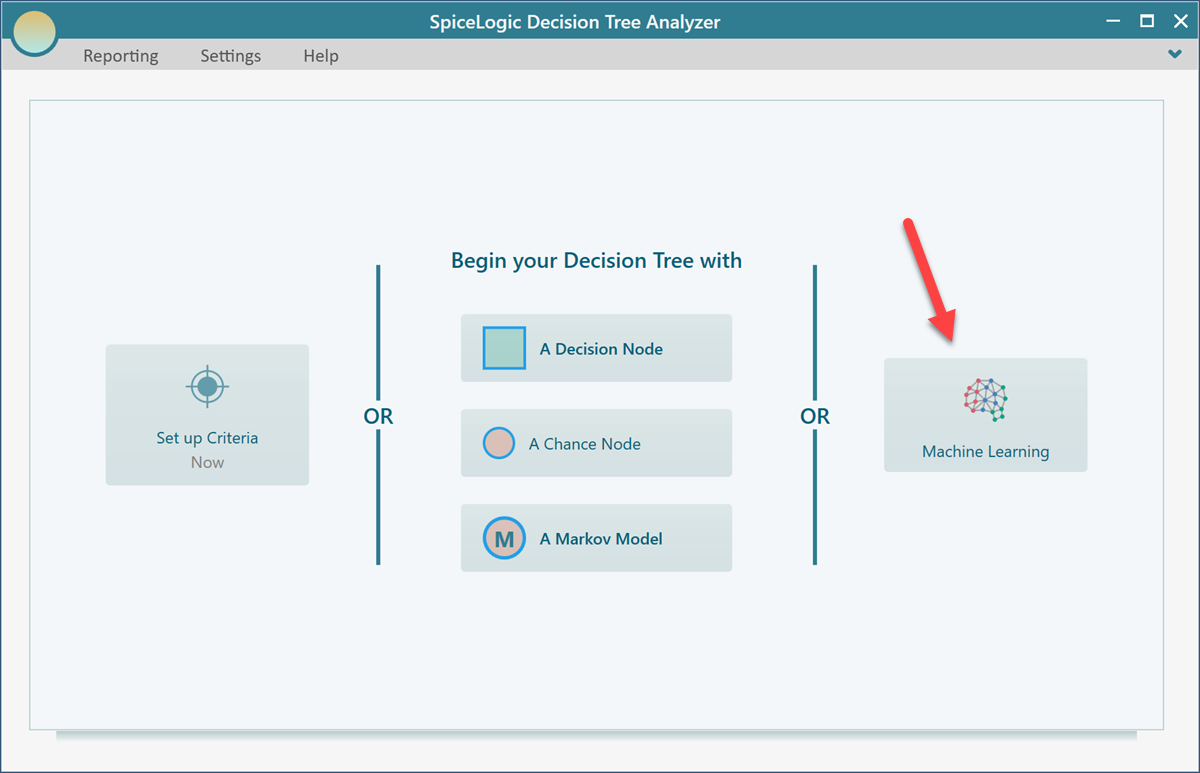
The Decision Tree software can read this kind of data from a CSV file, an Excel file, or a SQL Server database. Say you have it in an Excel file. To turn that data into a decision tree, open the Decision Tree software and click the Machine Learning button shown below.
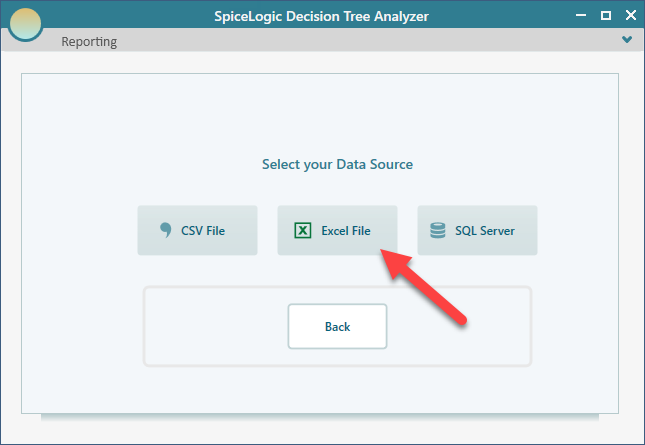
Next, pick the type of data source you are using. For this example, choose Excel.
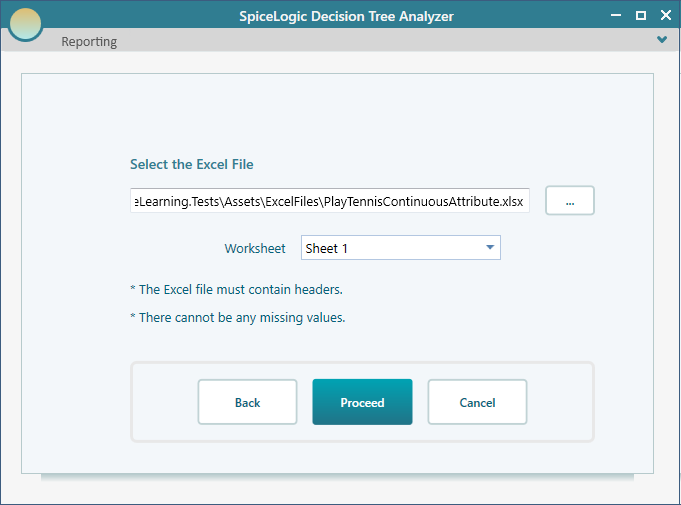
Now point it at your Excel file and choose the sheet that holds your data. If your workbook has more than one sheet, this is where you tell the software which one to read.
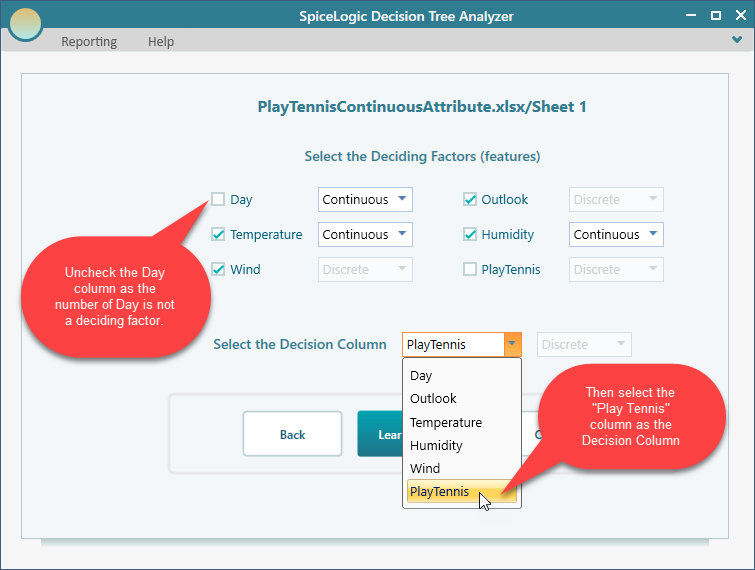
After you click Proceed, the software lists every column it found in your data. Tick the columns that you think actually affect the decision. The Day number, for example, has nothing to do with whether people play tennis, so leave the Day column unchecked. Then mark PlayTennis as the Decision Column, since that is the outcome you want the tree to predict.
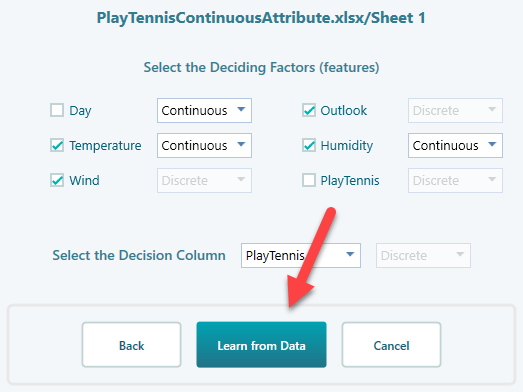
Now click the Learn from Data button.
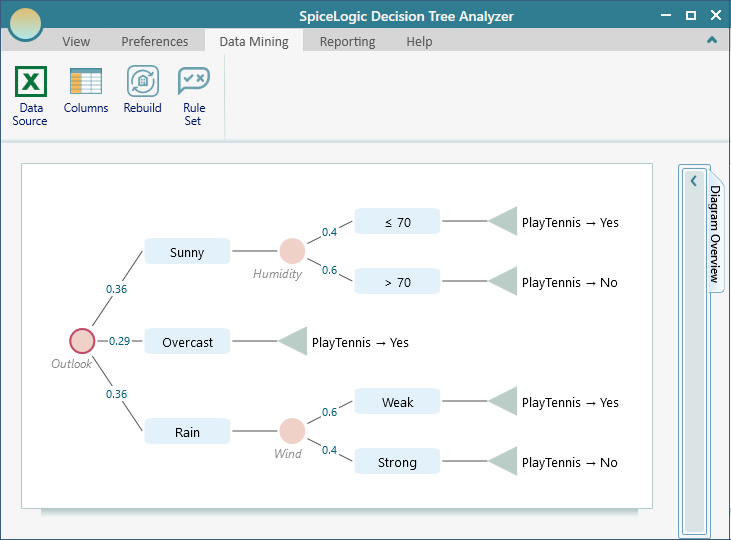
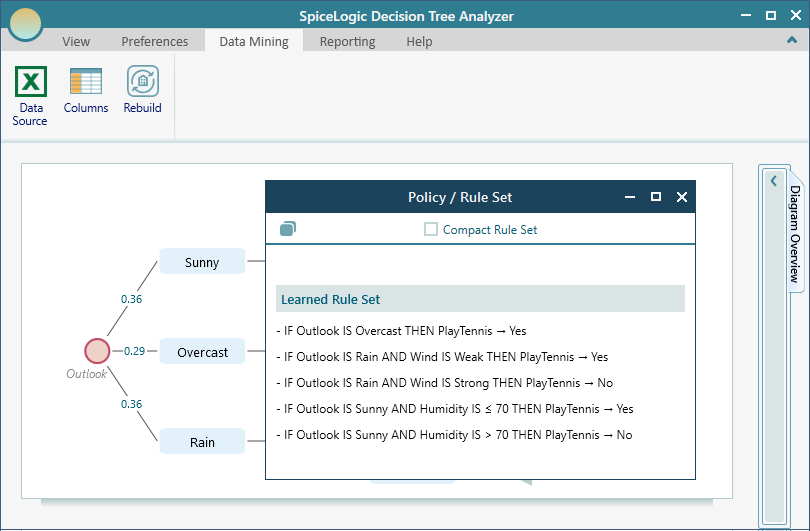
The software runs a machine learning algorithm over your data and builds a decision tree from it, like the one shown below. Read it from the top down. Each branch is a question about the weather, and following the answers leads you to a prediction of whether the players will show up. So on a sunny day with high humidity, you follow those branches and the tree tells you what to expect.
Click the Rule Set button to see the same tree written out as plain if-then rules. Some people find the rules easier to read and share than the tree diagram. A rule reads like "if the outlook is sunny and the humidity is high, then the players do not play", which is easy to hand to someone who never saw the tree.
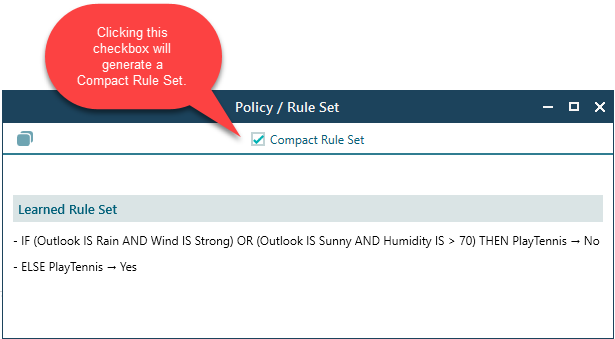
If you tick the Compact checkbox, the software produces a shorter rule set. It joins conditions that lead to the same outcome with "OR", so you get fewer, tidier rules that say the same thing. For example, two separate rules that both end in "do not play" get folded into one, which is much easier to scan.
A few buttons let you adjust things without starting over:
- Rebuild builds the tree again from the same data source. This is handy after your data has changed, for example once you have added a few more weeks of records.
- Columns lets you go back and change which columns count as deciding factors, so you can add or drop a factor and see how the tree changes. Drop the humidity column, rebuild, and you can see right away how much it mattered.
- Data Source lets you switch to a different source, such as another SQL Server database, or a different Excel or CSV file path.

Test against a data source and get the Confusion Matrix
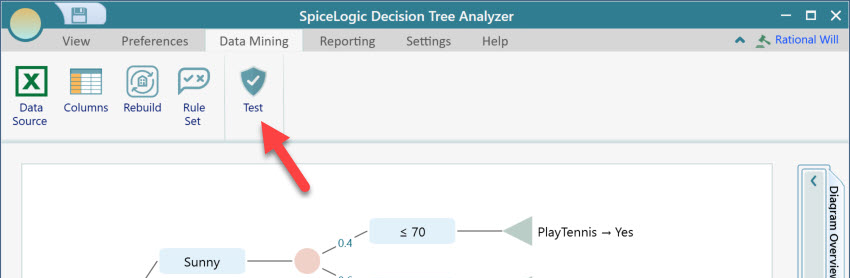
Once a classification tree is built, it is worth checking how well it actually predicts. The software lets you run the tree against a set of data and reports back with a Confusion Matrix and other performance numbers. A confusion matrix simply counts how often the tree got each answer right and how often it got it wrong. That way you can trust the tree before you rely on it. To start, click the Test button shown here.
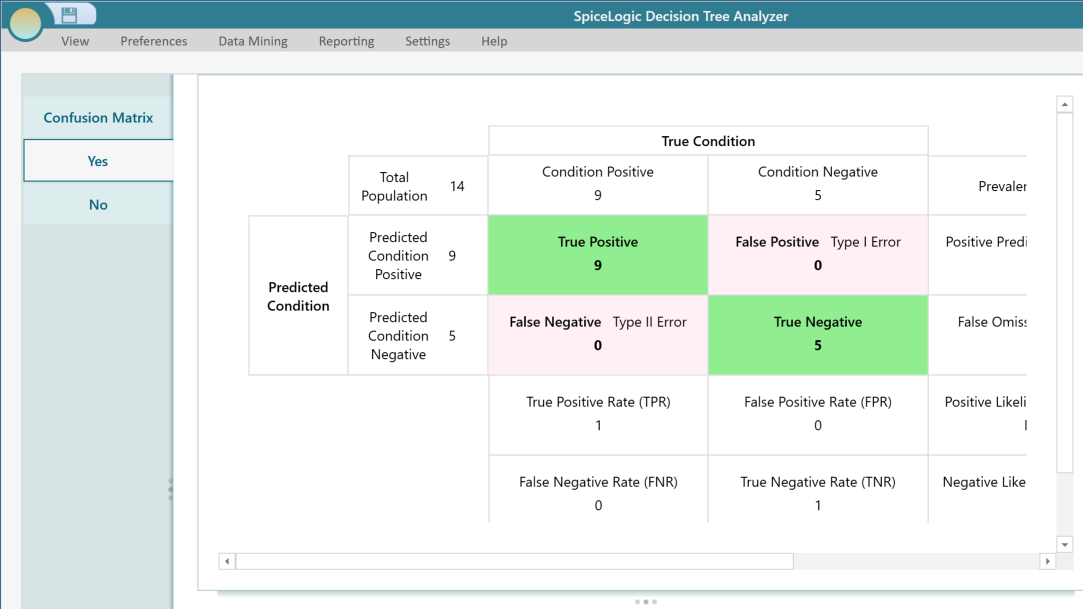
You will be asked to pick a data source, the same way you did when you first built the tree. You can test against the original data, or against a fresh batch you held back. Testing on a fresh batch is the better check, because it shows how the tree does on records it has never seen. Once it finishes, you get a Confusion Matrix view like the one below.
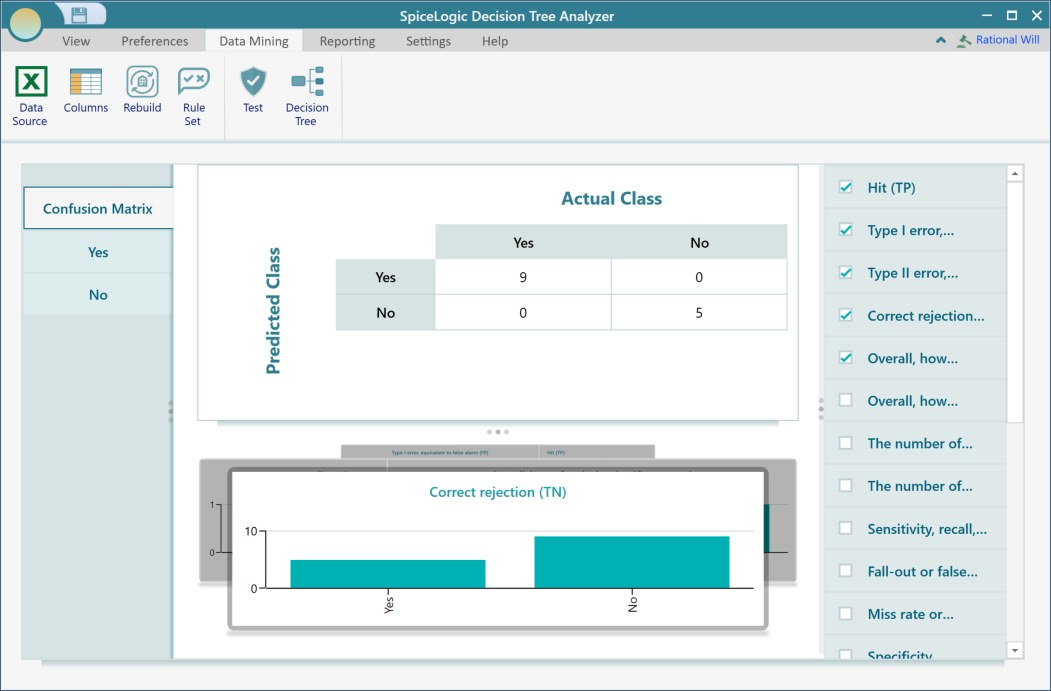
To look closer at how the tree did on one particular class, click that class in the menu on the left. For example, clicking the Yes menu button shows the detailed view below, with the metrics for that single class.
If you want the full meaning behind each of these numbers, the Wikipedia Confusion matrix page explains every metric clearly.

Regression Tree
A regression tree predicts a number instead of a category. The answer it gives back is a real value, like the price of a house or an expected salary.
Building one works just like building a classification tree, with one difference: the Decision Column has to be a continuous, number-type variable. Sticking with the tennis example, suppose you no longer just want to know whether people play. You want to predict how many minutes they will play in a day, based on the outlook, temperature, wind, humidity, and so on. Your data set for that might look like the table below.
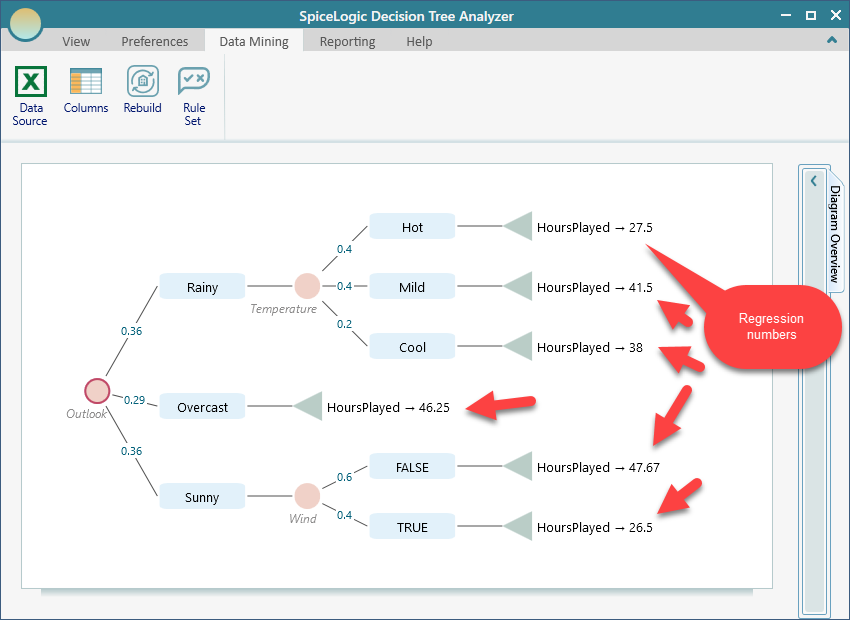
Follow the same steps shown for the Classification Tree analysis and build the tree. The result will look like the one below. The difference is at the leaves: instead of a Yes or No label, each ending gives you a predicted number. So one branch might end in 45 minutes and another in 90 minutes.
One thing to note: for a regression tree, the Test button does not appear. That is on purpose. A confusion matrix only makes sense for a classification tree, where the answers are categories you can count as right or wrong. It does not apply when the prediction is a number.
Breast Cancer Data set - example
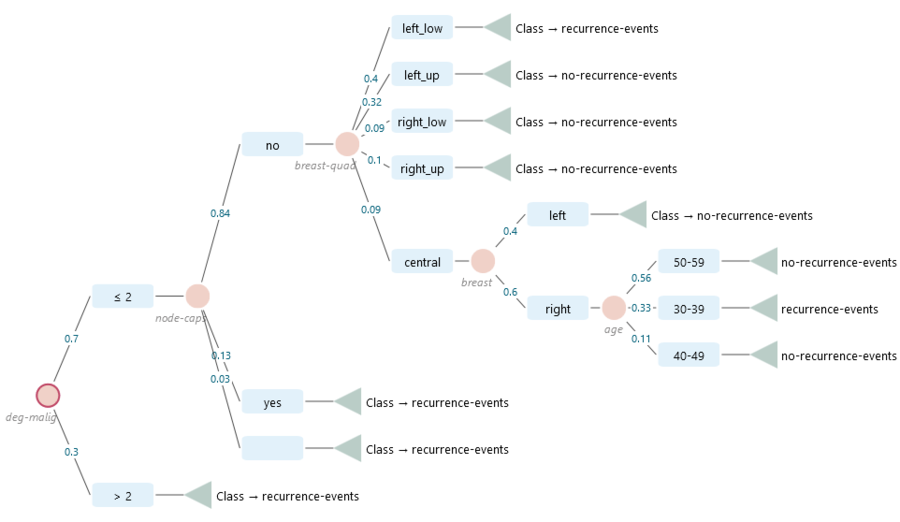
Let's try something real and useful. We can take a breast cancer data set and build a decision tree that classifies whether a recurrence event is likely.
You can download the CSV data set here: https://datahub.io/machine-learning/breast-cancer
The data set looks like this:
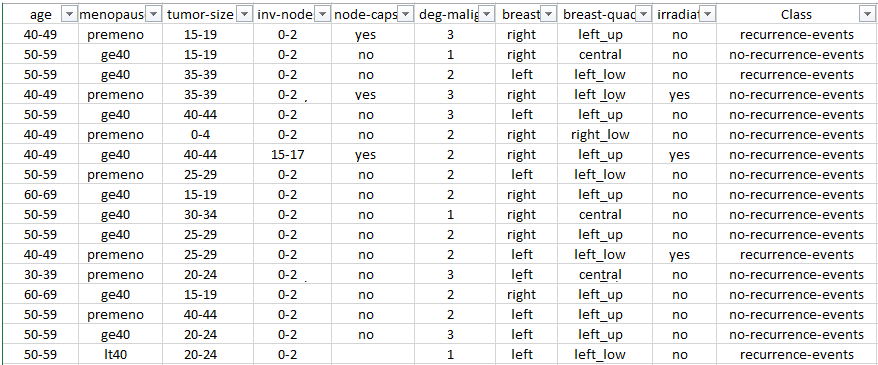
Start the Decision Tree software and open the Machine Learning wizard the same way as before. Choose the CSV file data source and select the columns shown below. In this example I unchecked two columns on purpose, just to keep the resulting tree smaller and easier to read.
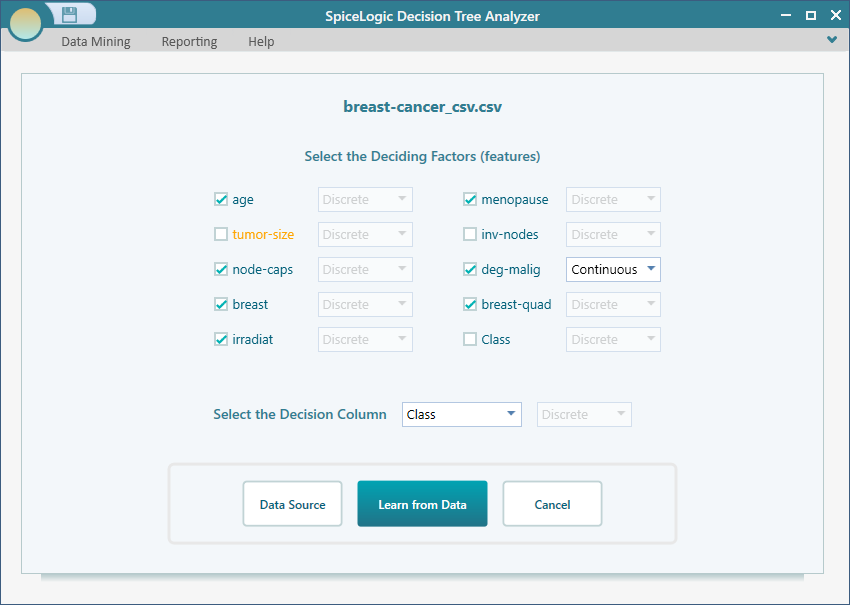
Now click the Learn from Data button. The software runs its machine learning algorithm over the data set and produces a decision tree like the one below. From here you can read off which factors point toward a recurrence event and which point away from it.