Weather forecasting using Markov Chain
Let's walk through a simple weather example. It is a nice way to see how a Markov chain works, because the weather tomorrow depends only on the weather today.
Here are the rules for our little weather world:
- You almost never get two nice days in a row.
- After a nice day, you are just as likely to get snow as rain the next day.
- After a day of snow or rain, there is an even chance the next day brings more of the same.
- When the weather does change away from snow or rain, only half of those changes lead to a nice day.
The question we want to answer: if today is nice, what is the chance it will be nice again one week from now?
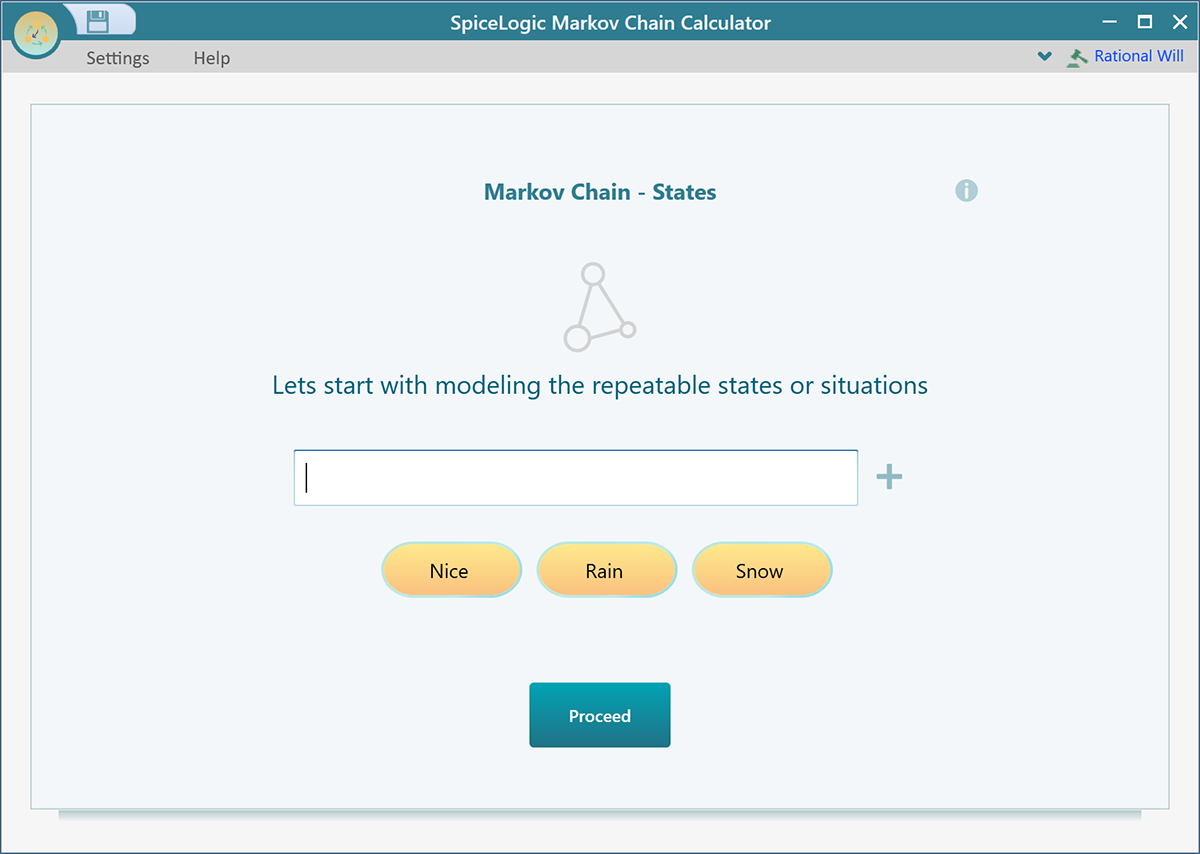
We can work this out step by step. Start the SpiceLogic Markov Chain Calculator, enter the three states - "Nice", "Rain", and "Snow" - and click Proceed.
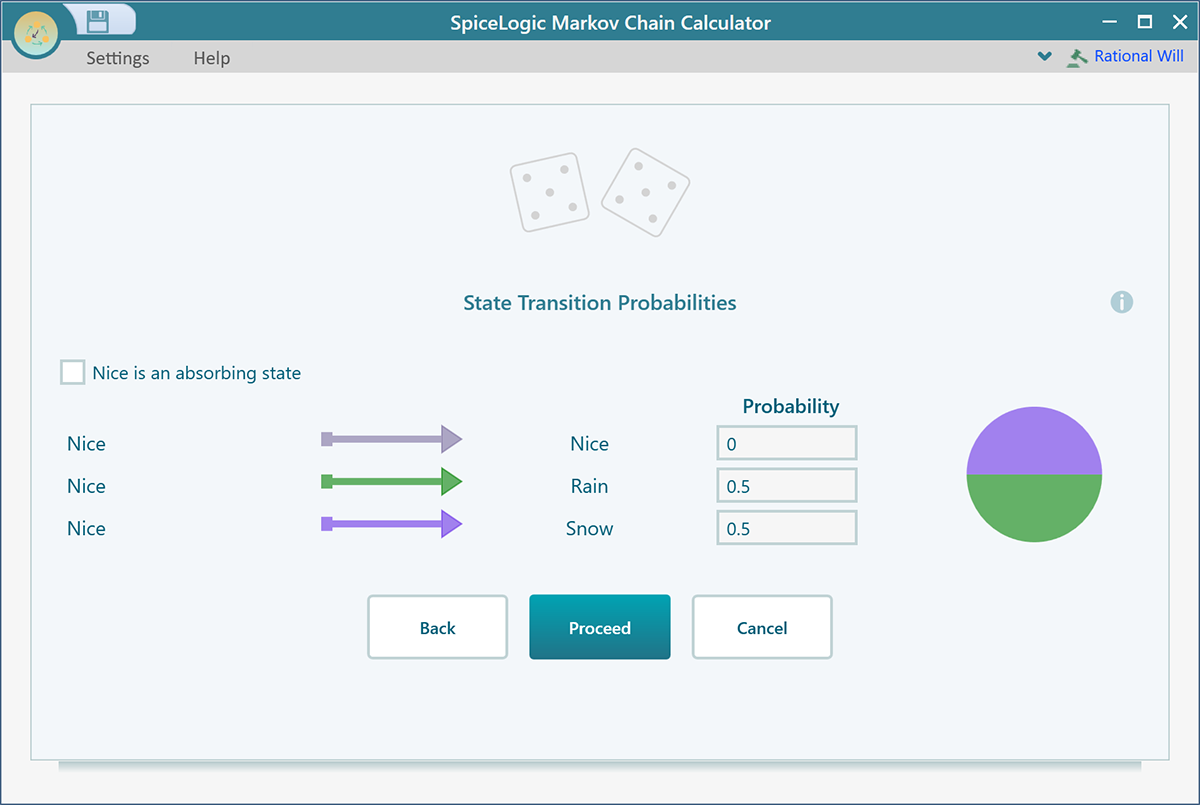
First, set the transition probabilities for the "Nice" state. These are the chances for what tomorrow looks like, given that today is nice. For example, if a nice day almost never repeats, the chance of another nice day is low, and the rest of the chance is split between rain and snow. Fill them in as shown below.
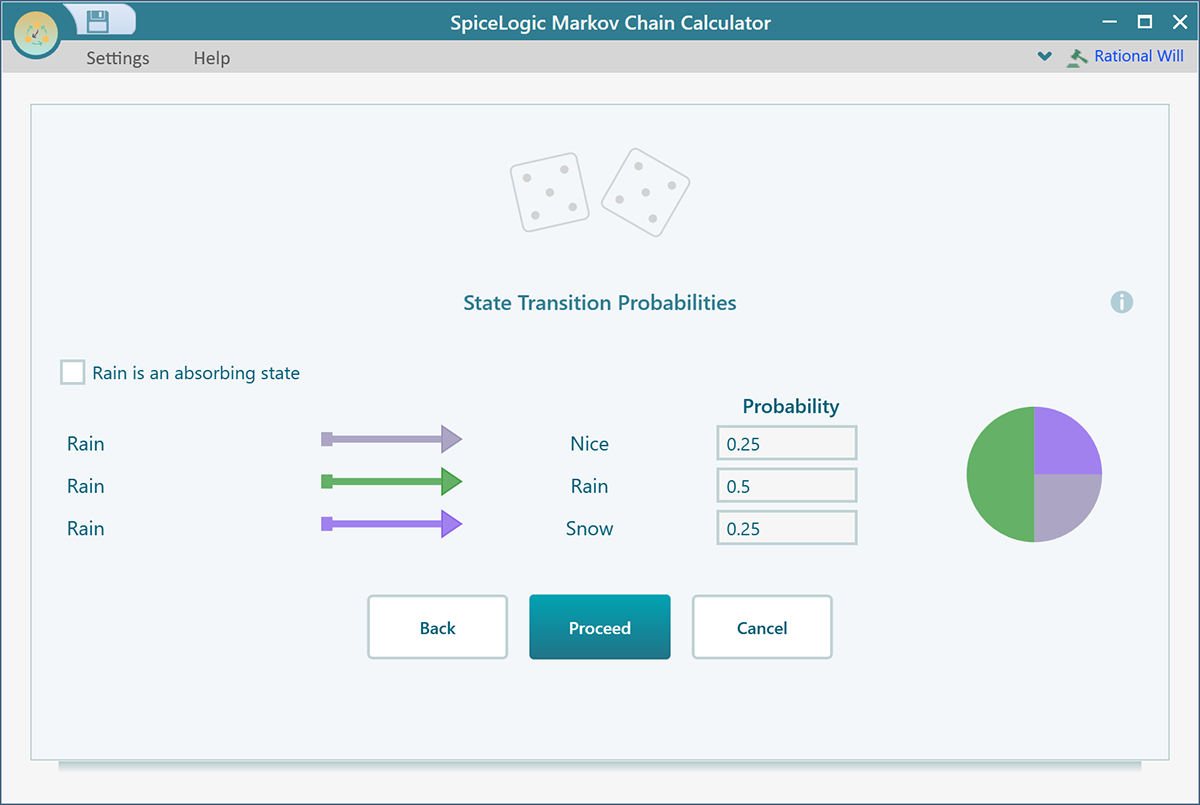
Now click Proceed. This time you set the transition probabilities for the "Rain" state, the chances of what comes after a rainy day. A rainy day often leads to more rain, so that chance is higher, and the rest goes to a nice day or snow. Fill them in as shown below.
Click Proceed again. Now you enter the transition probabilities for the last state, "Snow", the chances of what follows a snowy day. Like rain, snow often leads to more snow, with the rest split between a nice day and rain. Fill them in as shown below.

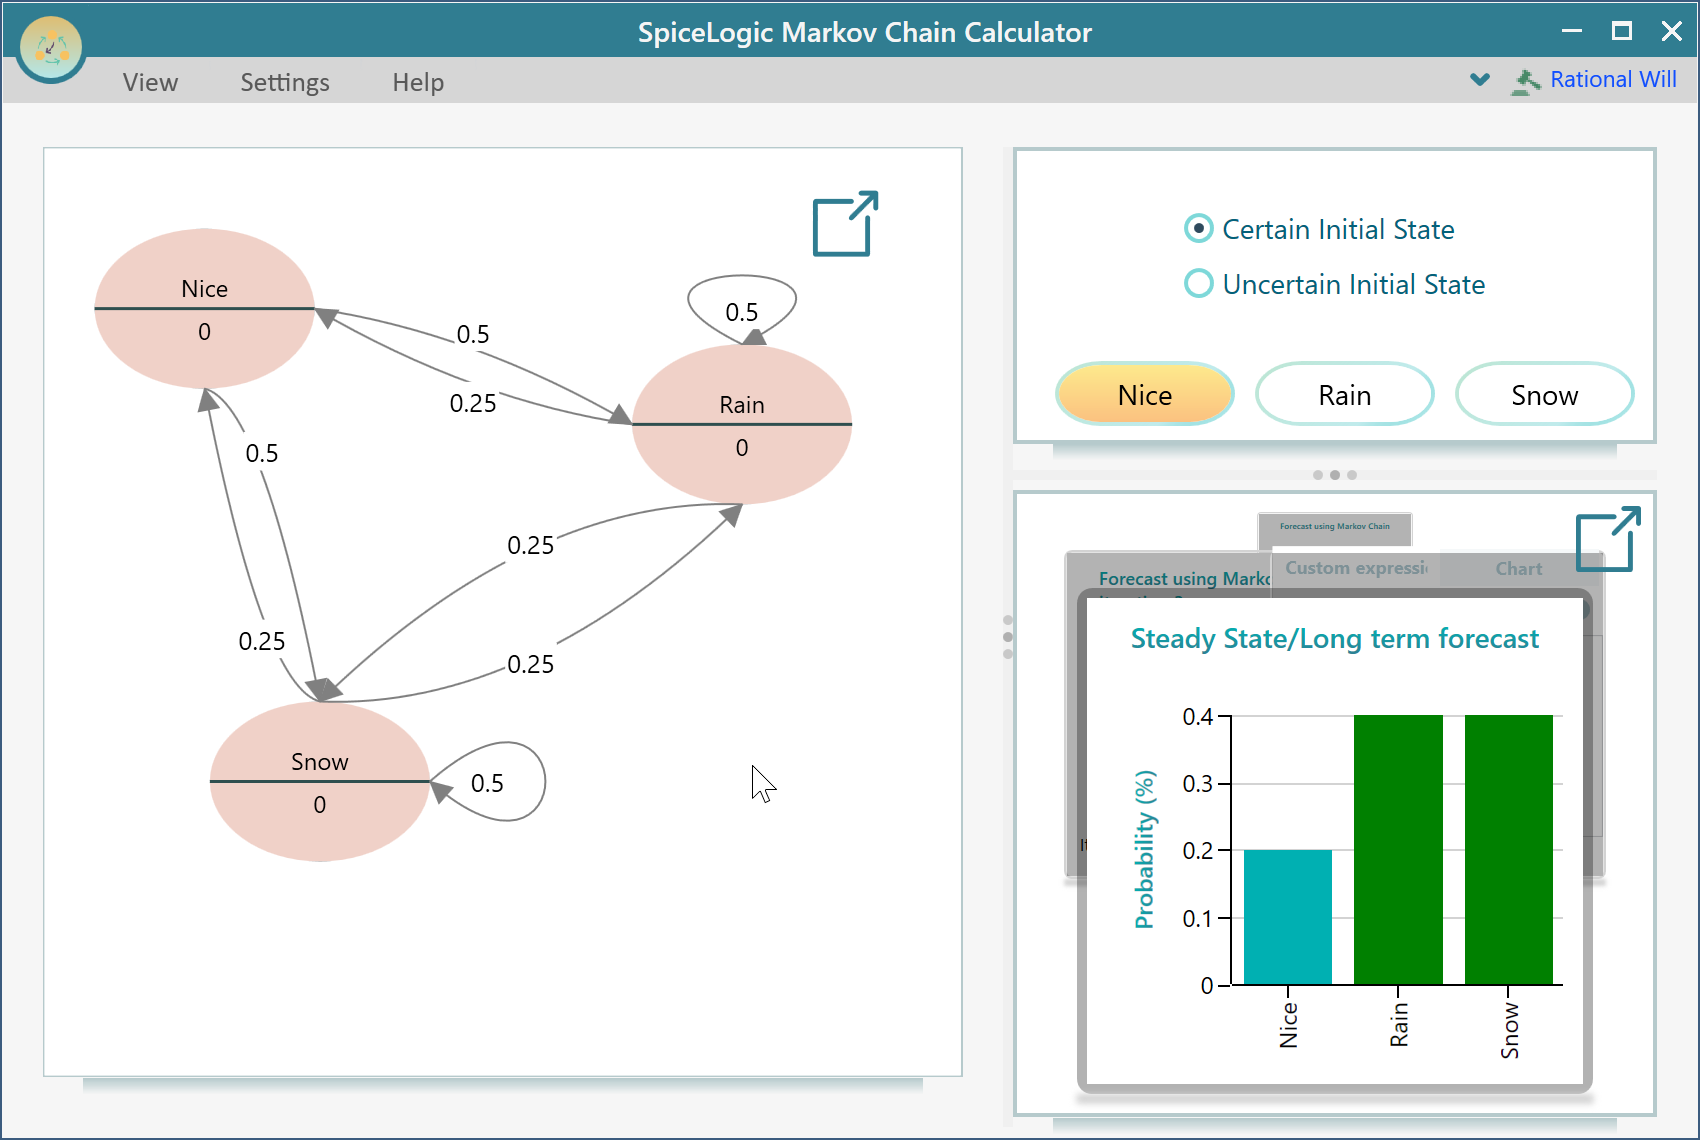
Click Proceed one more time, then click "Finish" on the next screen. The software builds your Markov chain model and shows it to you, as below.
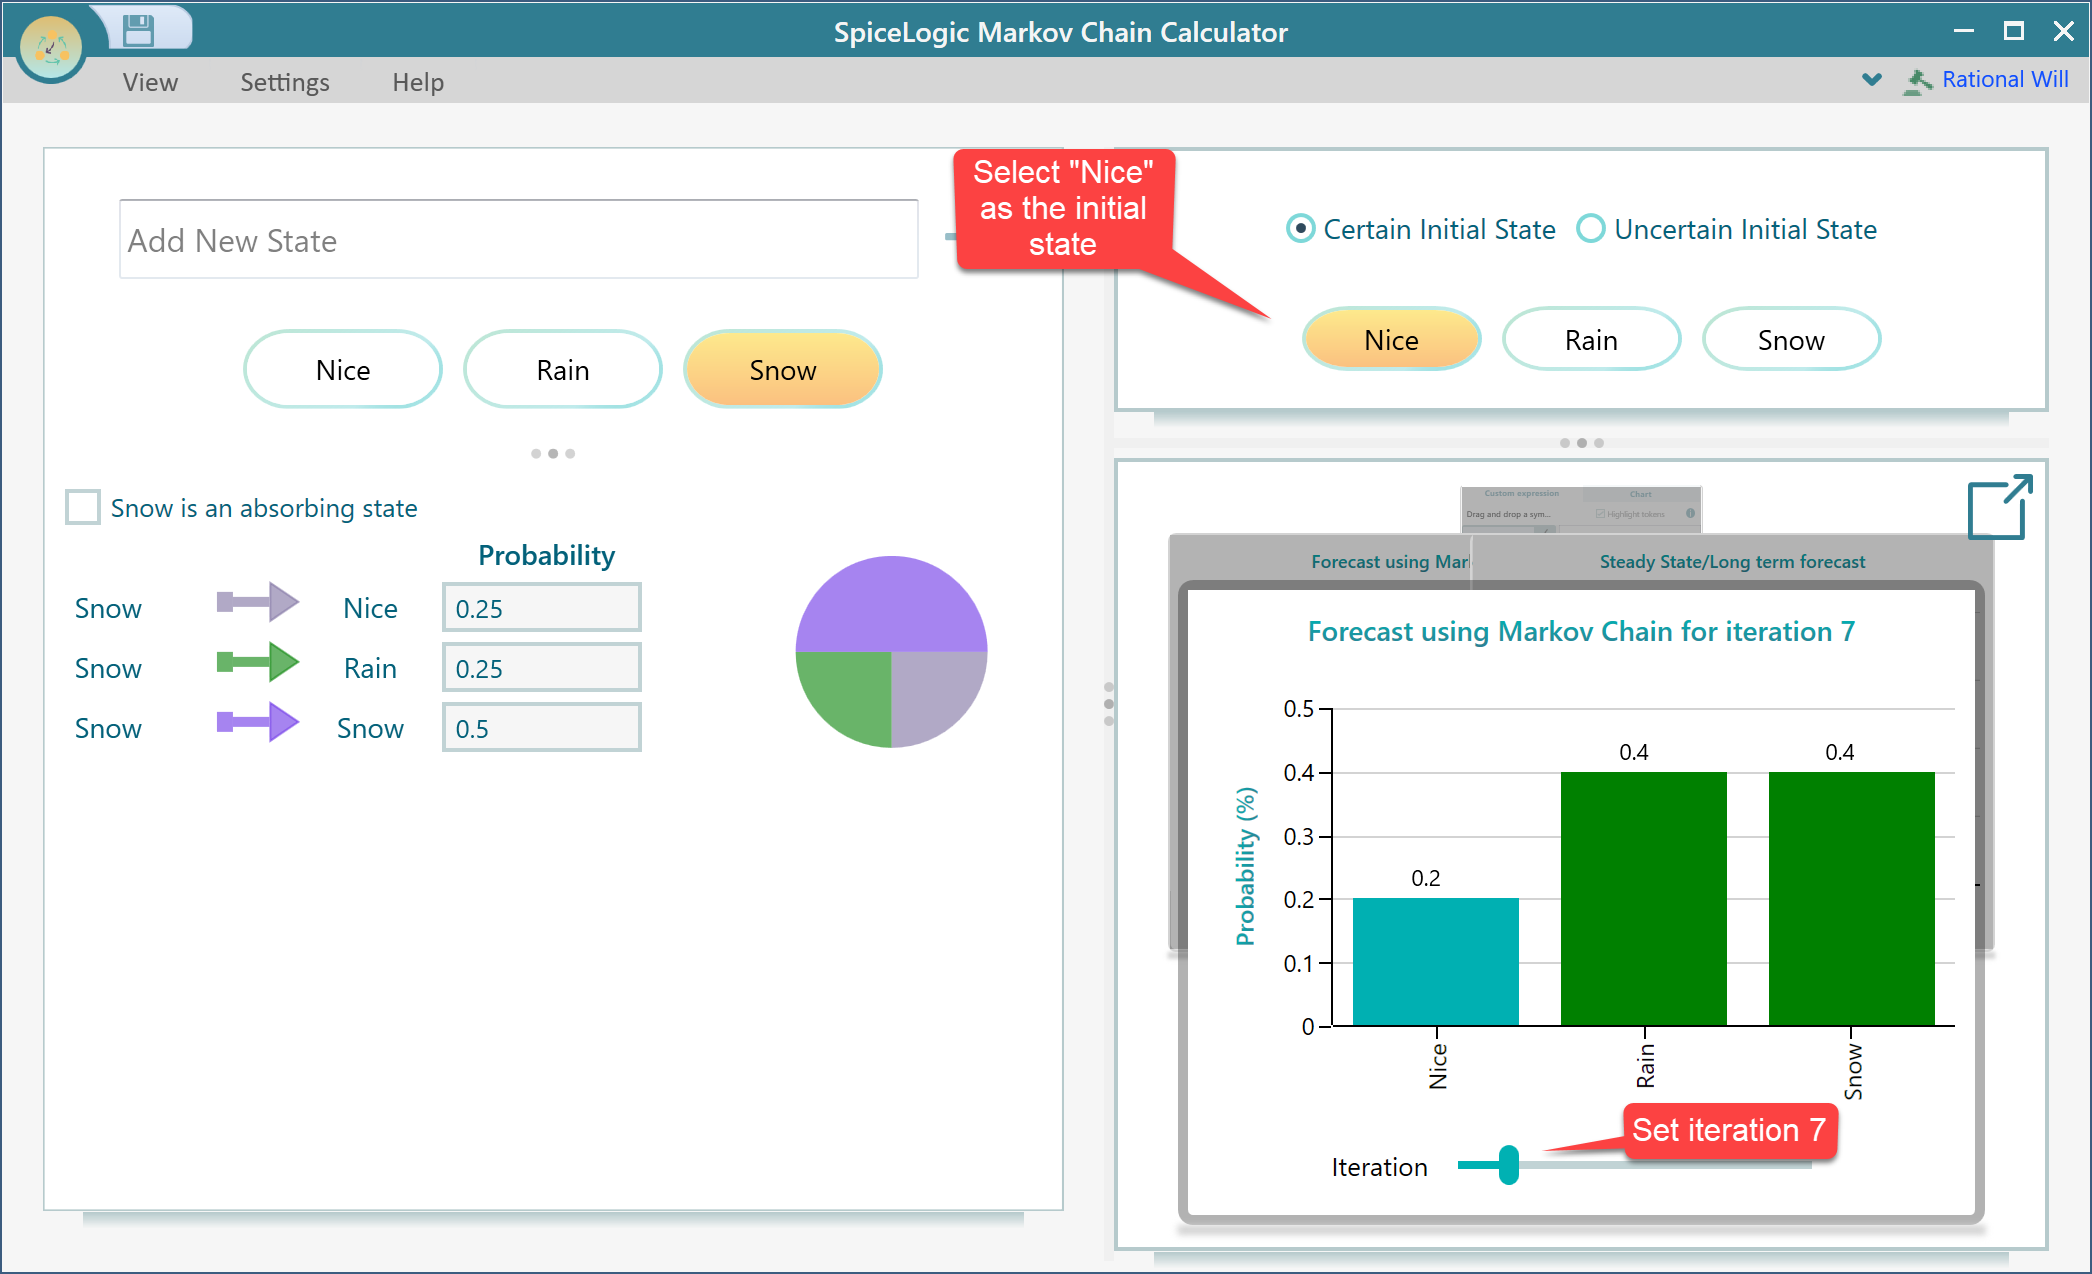
And there is our answer. If today is nice, the chance of nice weather one week from now is 20%.
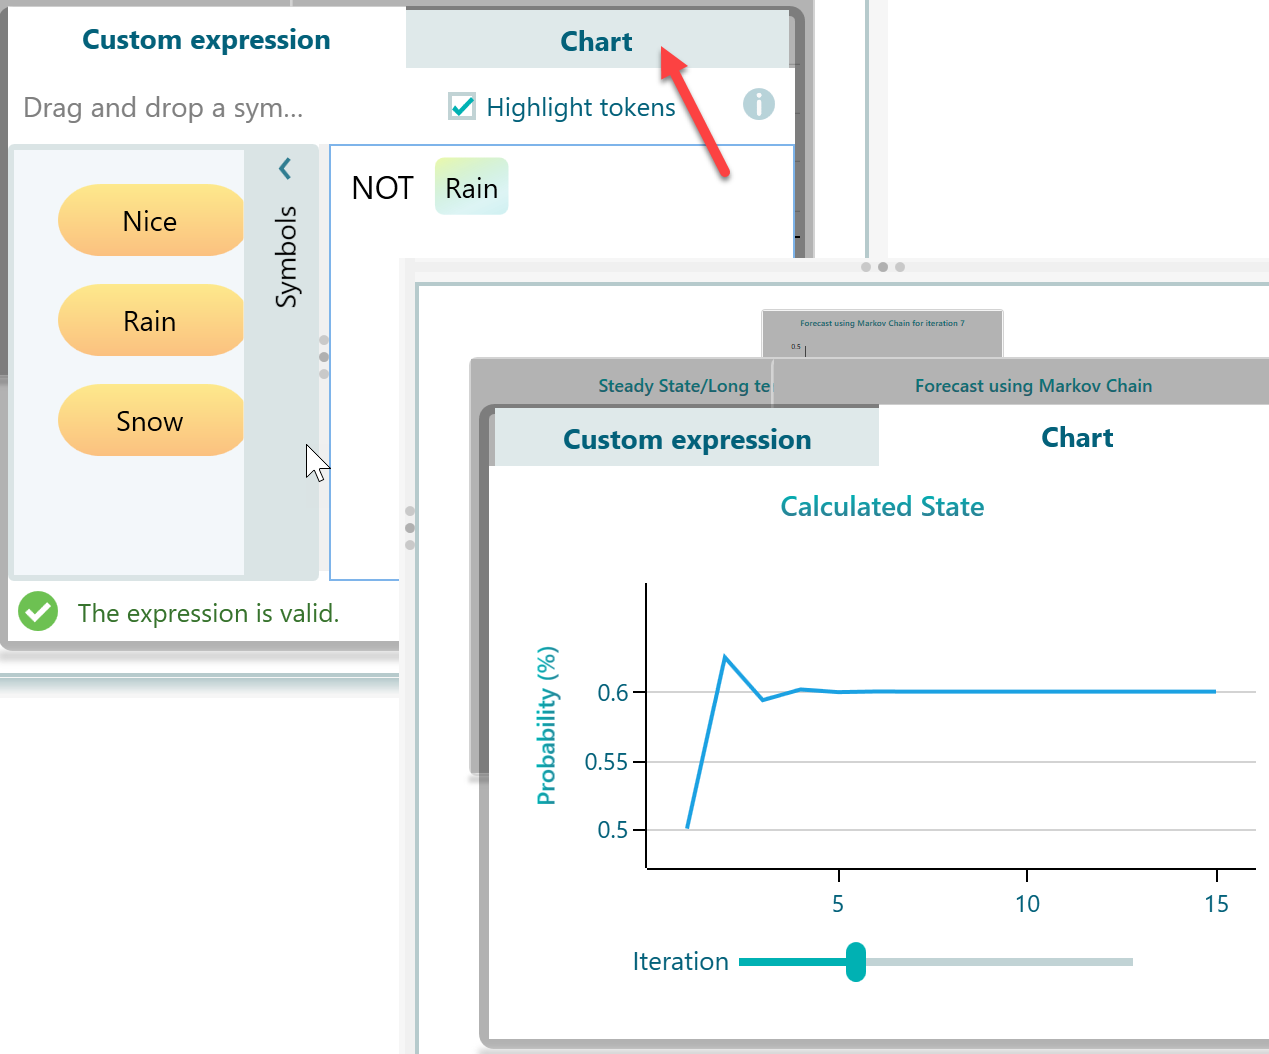
You do not have to stop there. The model can answer related questions too. For example, what is the chance it is not raining a week from now? Open the expression editor, type the expression NOT Rain, and click the Chart tab to see the prediction. It turns out the chance of no rain after a week is 60%.
Lastly, open the View menu and choose Decision Graph. This draws the Markov chain diagram, so you can see all the states and the arrows between them at a glance. The arrows show how one state leads to another, which makes the whole model easy to read in one picture.