Example: Gambler's ruin
This is the classic Gambler's Ruin problem. It is a nice, simple way to see what a Markov Chain can tell you about the long run.
Picture a reluctant gambler. His friends drag him to a casino, and he brings only $50 to play with. He does not know much about gambling, so he picks roulette. On each spin he puts $25 on red. If red comes up, he wins $25. If black comes up, he loses his $25. So his chance of winning each spin is 50%.
He has set himself two simple rules for when to stop. He quits if he runs out of money (down to $0). He also quits if he gets ahead by $25, so he is holding $75 in total. Here is the question we want to answer: starting from $50, how likely is he to walk out broke, and how likely is he to walk out a winner?
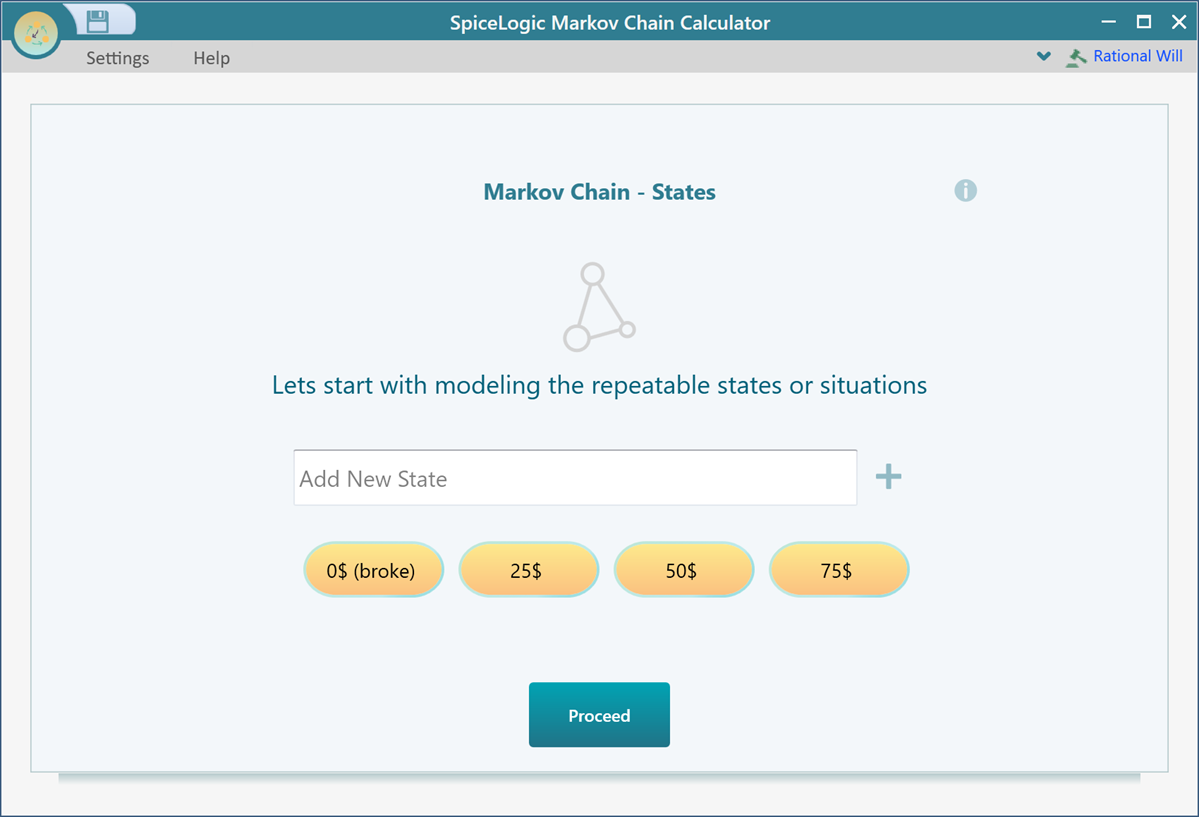
We can answer that by modeling the whole thing as a Markov Chain and watching where it settles over time. The amount of money he is holding is his state. There are four possible states: $0, $25, $50, and $75. To get started, open the SpiceLogic Markov Chain Calculator and enter these four states, as shown below.
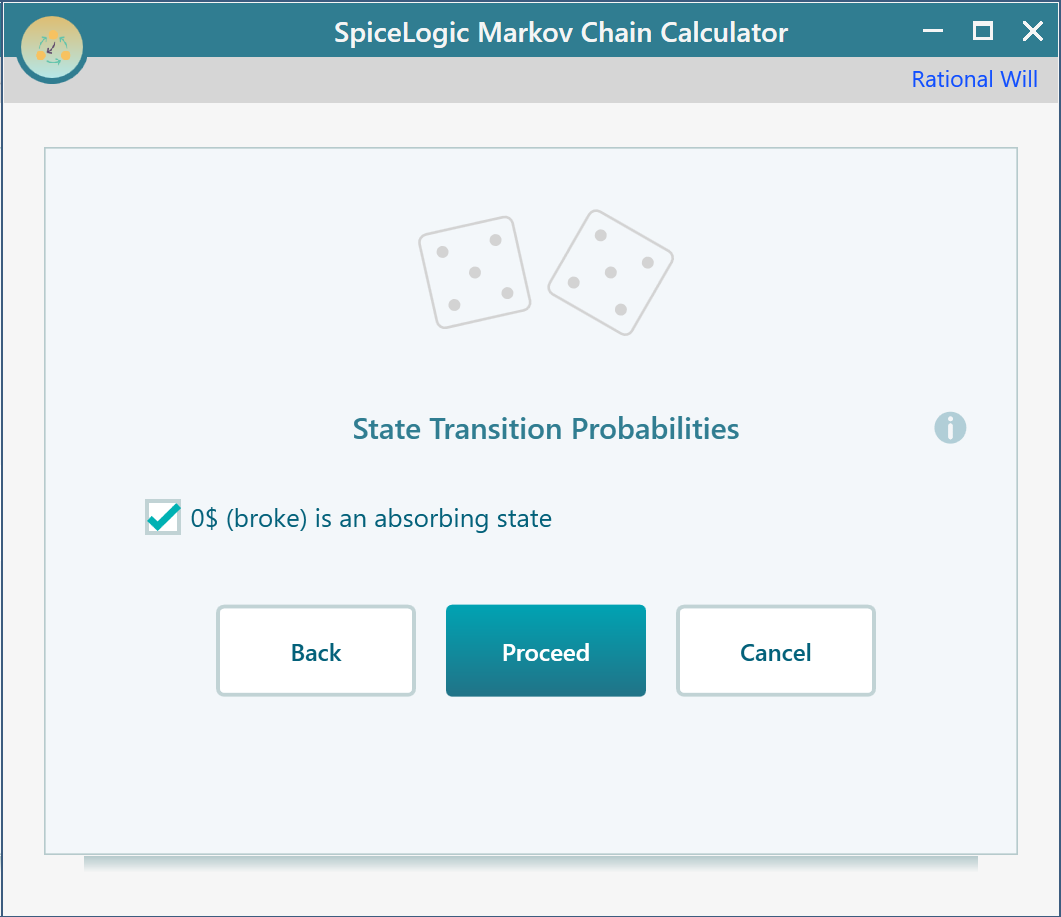
After you click Proceed, the calculator asks you to set the transition probabilities for the first state, $0 (broke). This one is an absorbing state. Once the gambler is broke, he is done, and there is no way to move to any other state from here. So mark $0 as an absorbing state.
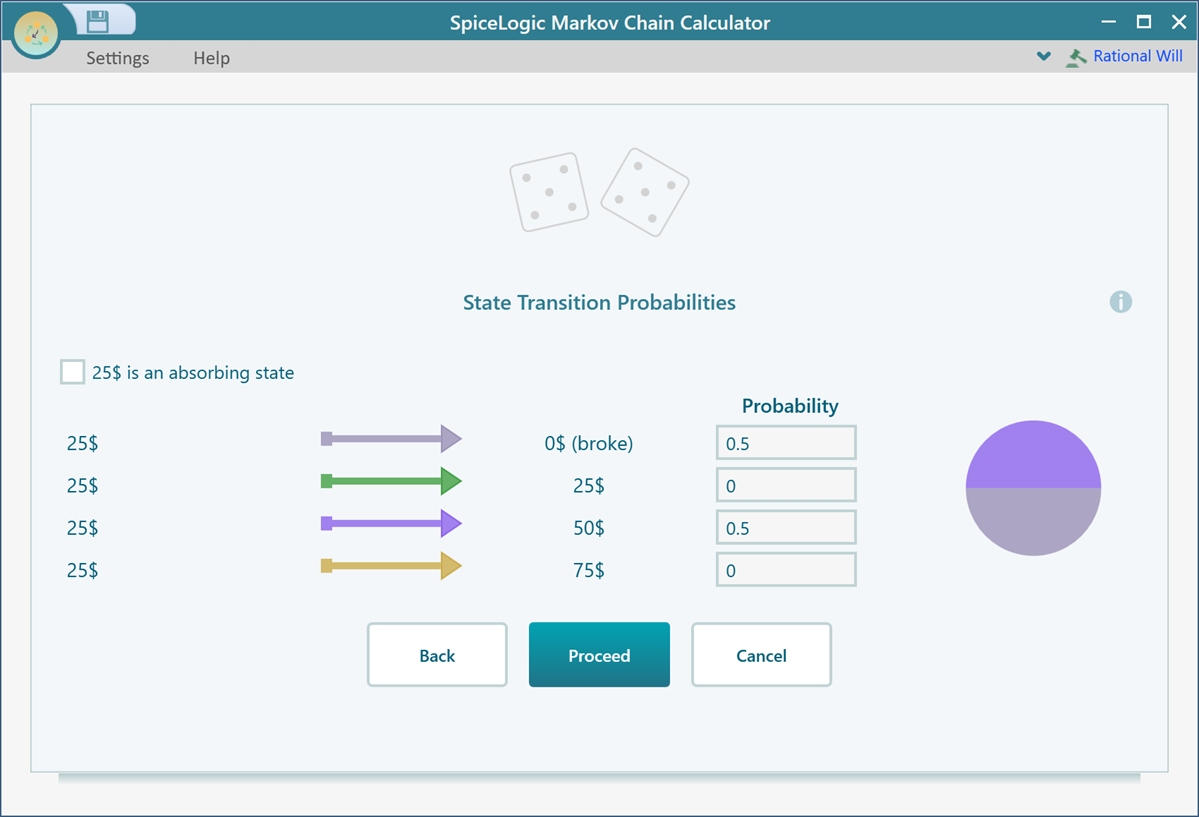
Click Proceed again and set the transition probabilities for the $25 state, as shown below. From $25 he either wins the next spin and climbs to $50, or loses it and drops to $0. Each of those has a 50% chance.
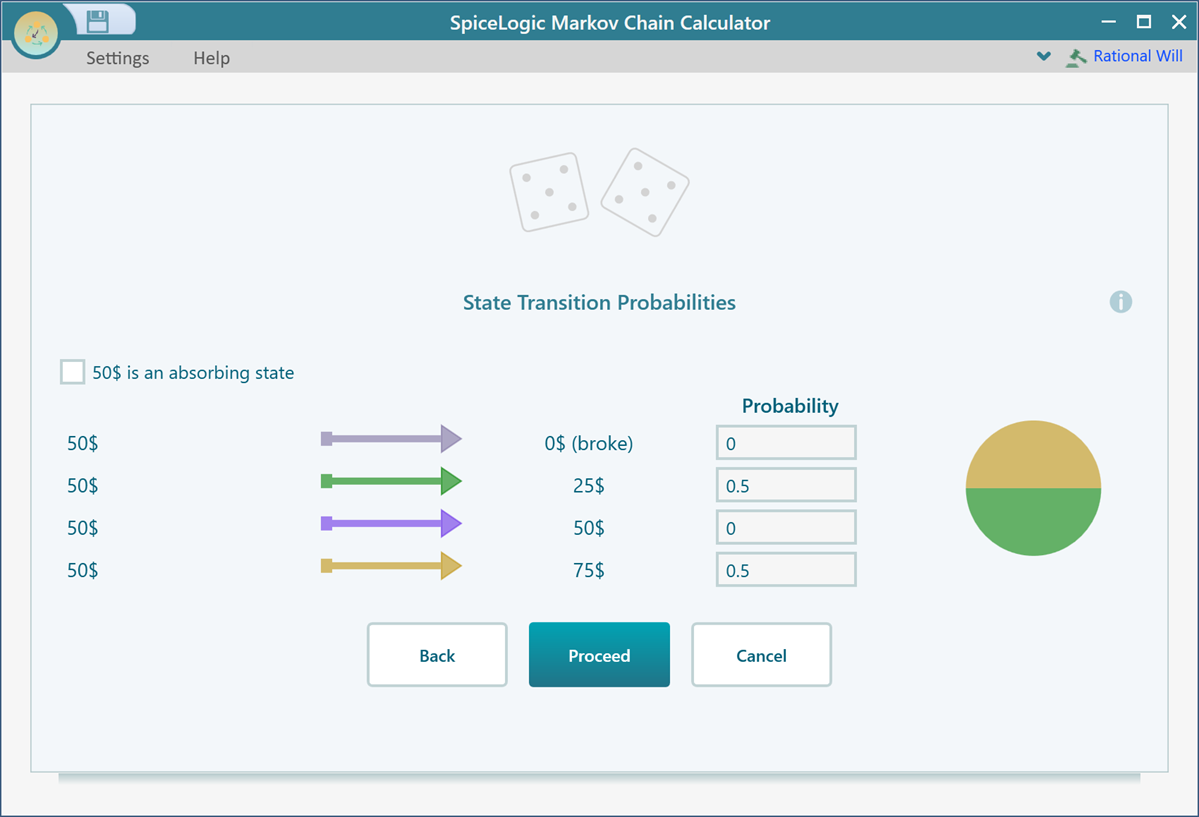
Click Proceed and set the transition probabilities for the $50 state, as shown below. This is where he starts. From here a win takes him up to $75 and a loss takes him down to $25, again 50% each way.
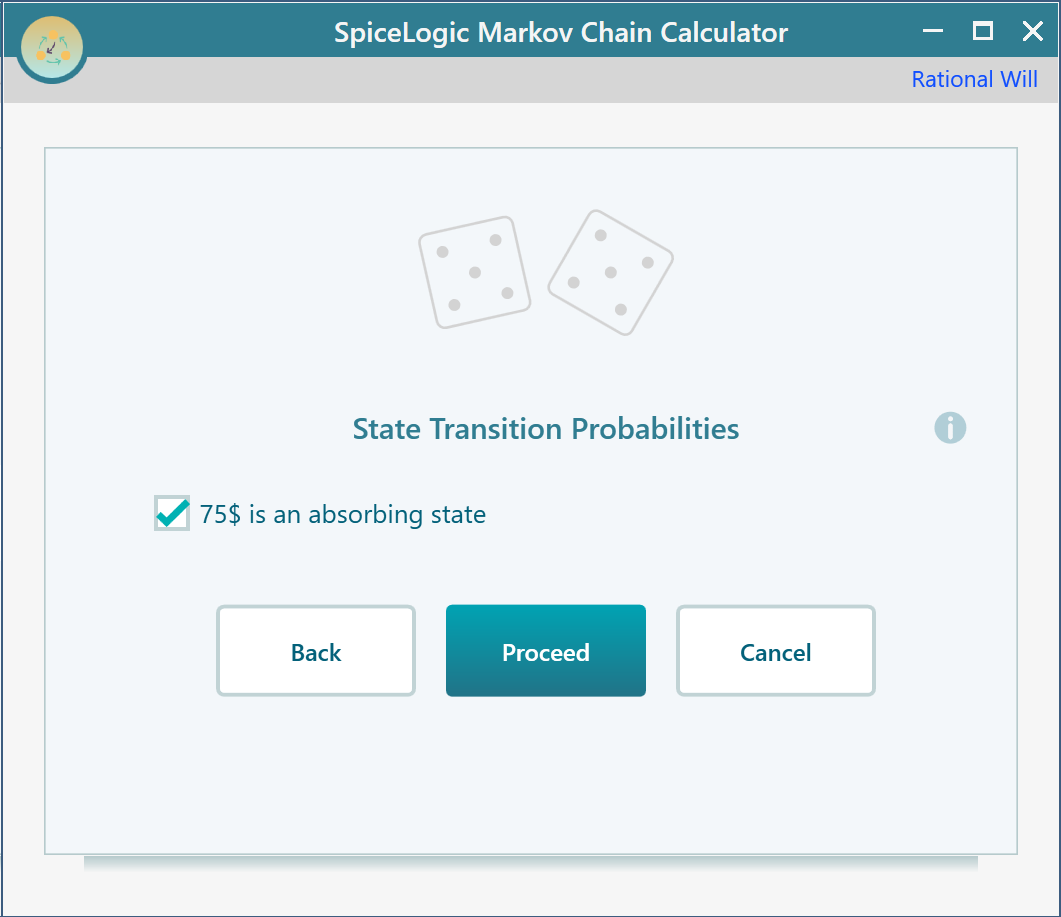
Finally, set the $75 state as an absorbing state. Once the gambler reaches $75 he hits his target and quits the game. So just like the broke state, there is no moving on from here.
Click Proceed, then click Finish on the last screen of the wizard. The calculator now shows you the result view.
Before it can run the analysis, it needs to know where the gambler begins. Pick the initial state for that. We are assuming he starts with $50, so select $50 here.
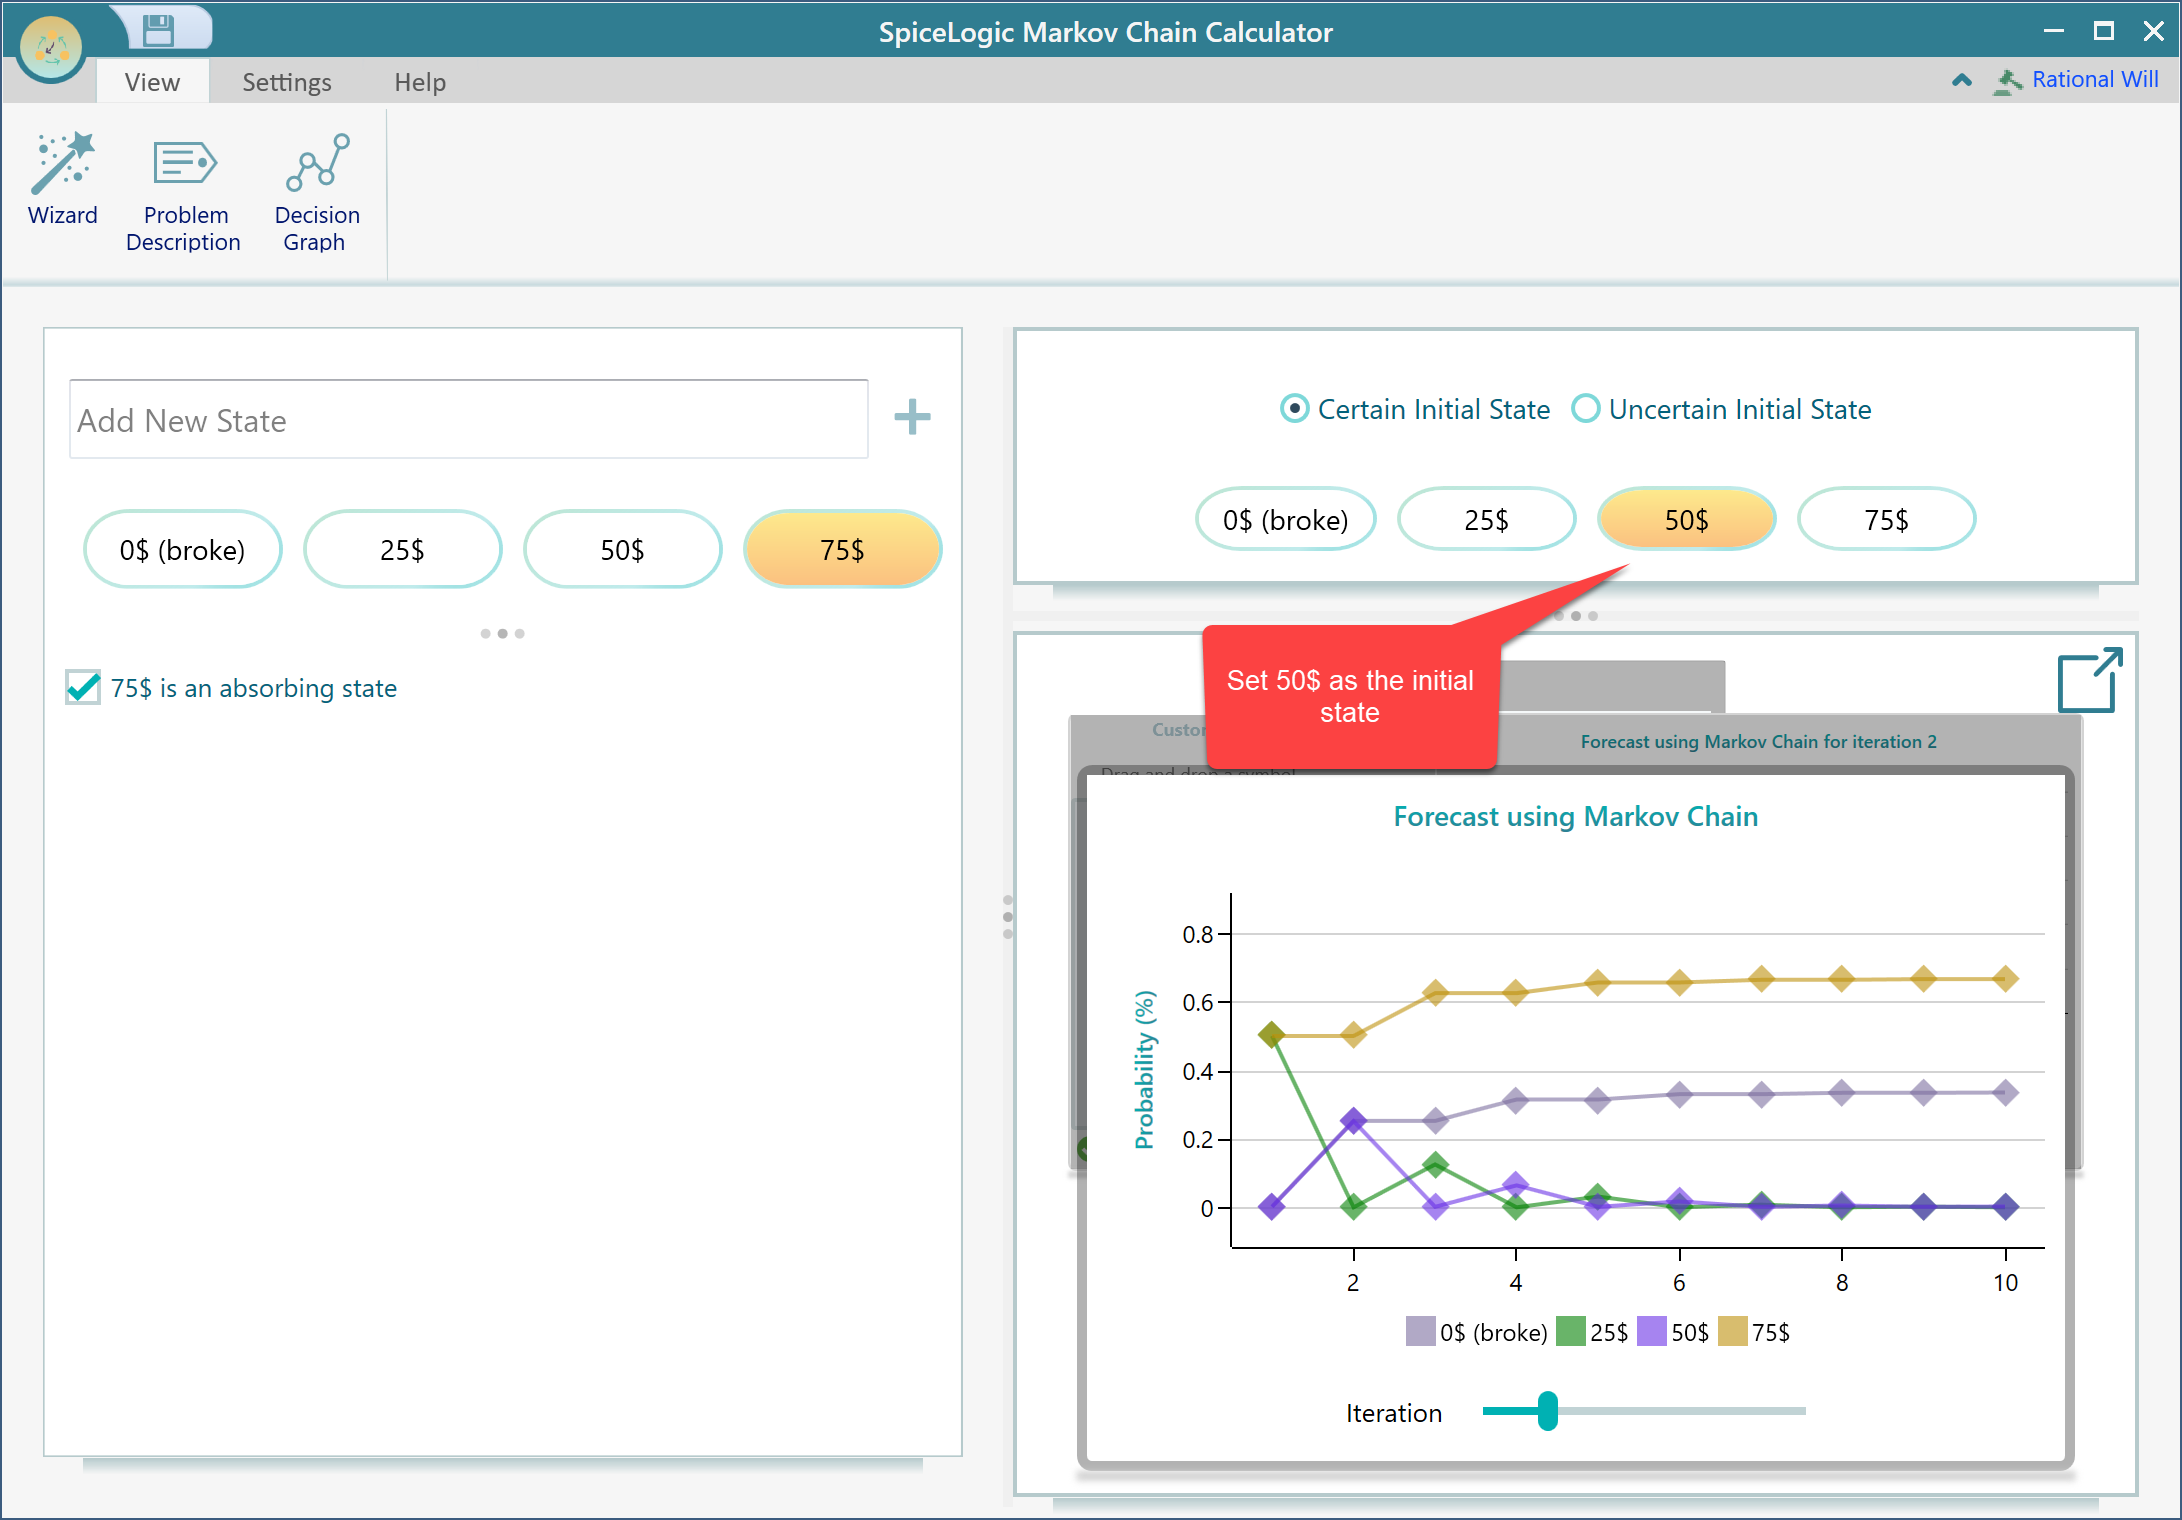
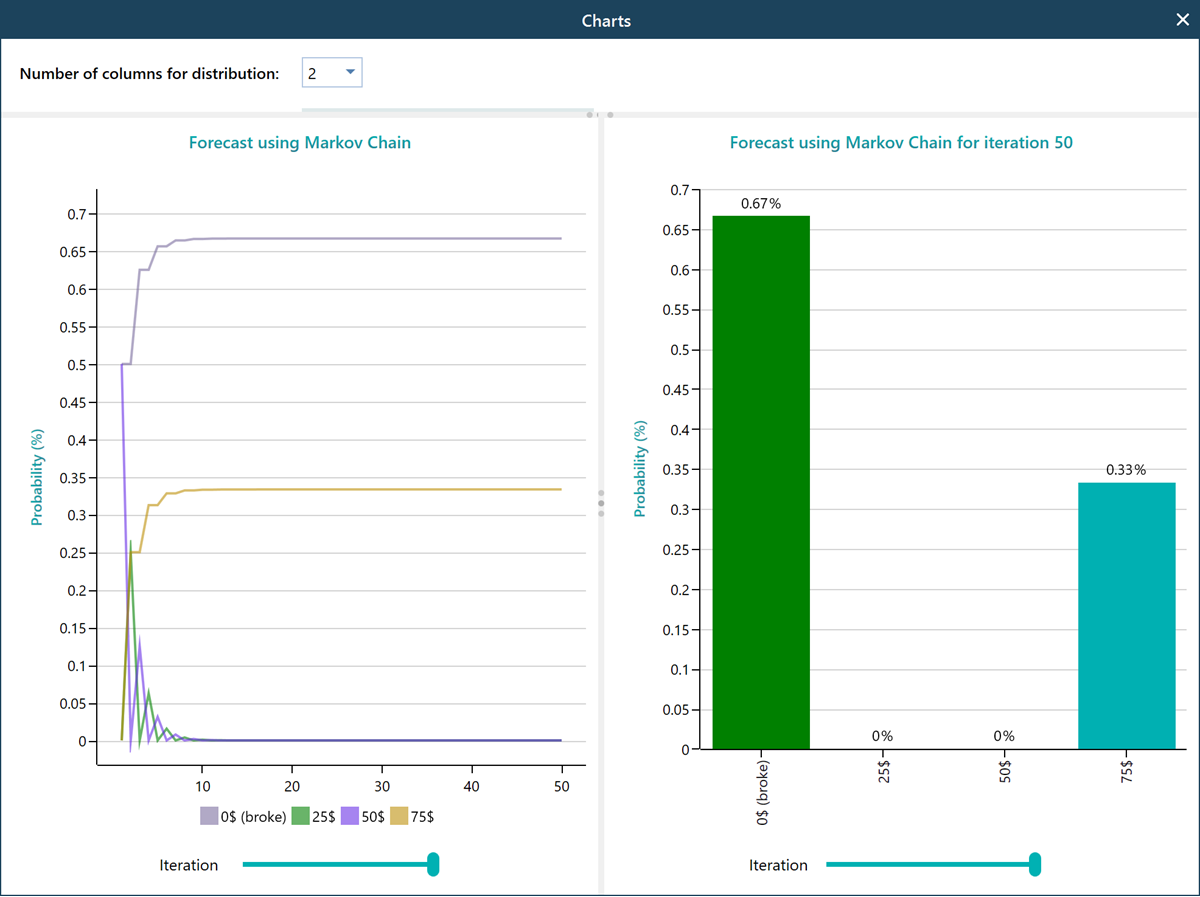
Pop out the charts from the carousel so you have a bigger view to work with. Then drag the iterations slider to 50 and watch what happens over 50 spins.
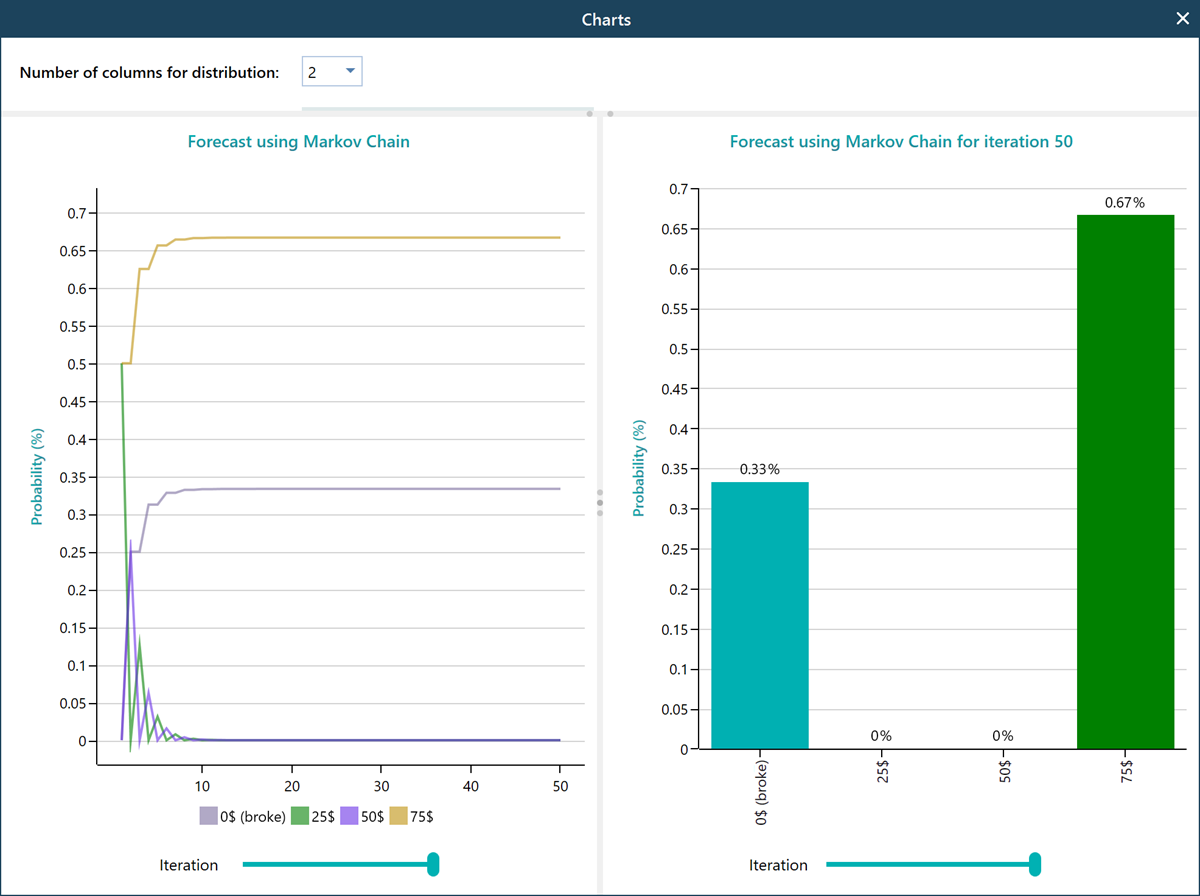
The numbers settle down to a clear answer. Starting from $50, the gambler has about a 33% chance of going broke and about a 67% chance of reaching $75 and walking away a winner. In other words, two times out of three he leaves ahead.
Now let's try a different starting point. What if the gambler had only $25 to begin with? You do not have to rebuild anything. Just change the initial state to $25, and the calculator gives you the new forecast right away.
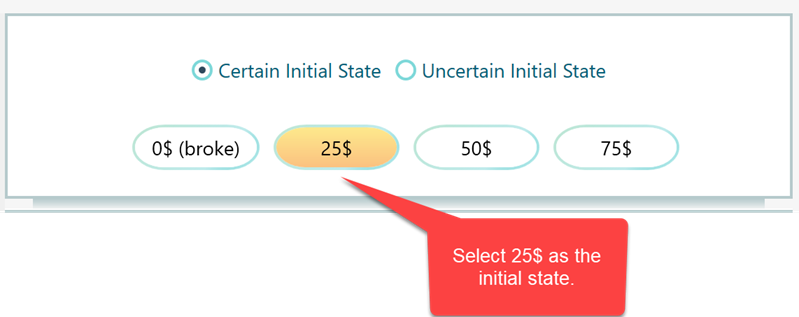
Once you switch the initial state to $25, the picture flips. Now the chance of going broke jumps to 67% and the chance of reaching $75 drops to 33%. Starting with less money makes a real difference. With $25 in hand he is twice as likely to lose everything as he is to hit his target. That is the whole point of the model. You can change one assumption and see exactly how the long-run odds move.