


Getting Started: Predicting health state
Model and analyze Markov Chain with rich Graphical Wizard. About Markov Chain Calculator →
This example builds a simple Markov Chain for a patient who moves between three health states: "Well", "Post-stroke", and "Dead". A Markov Chain is just a way to model something that changes from one state to another over time. The chance of the next state depends only on the state you are in right now, not on the whole history before it. Health works well for this. Where a person ends up next year mostly depends on where they are this year.
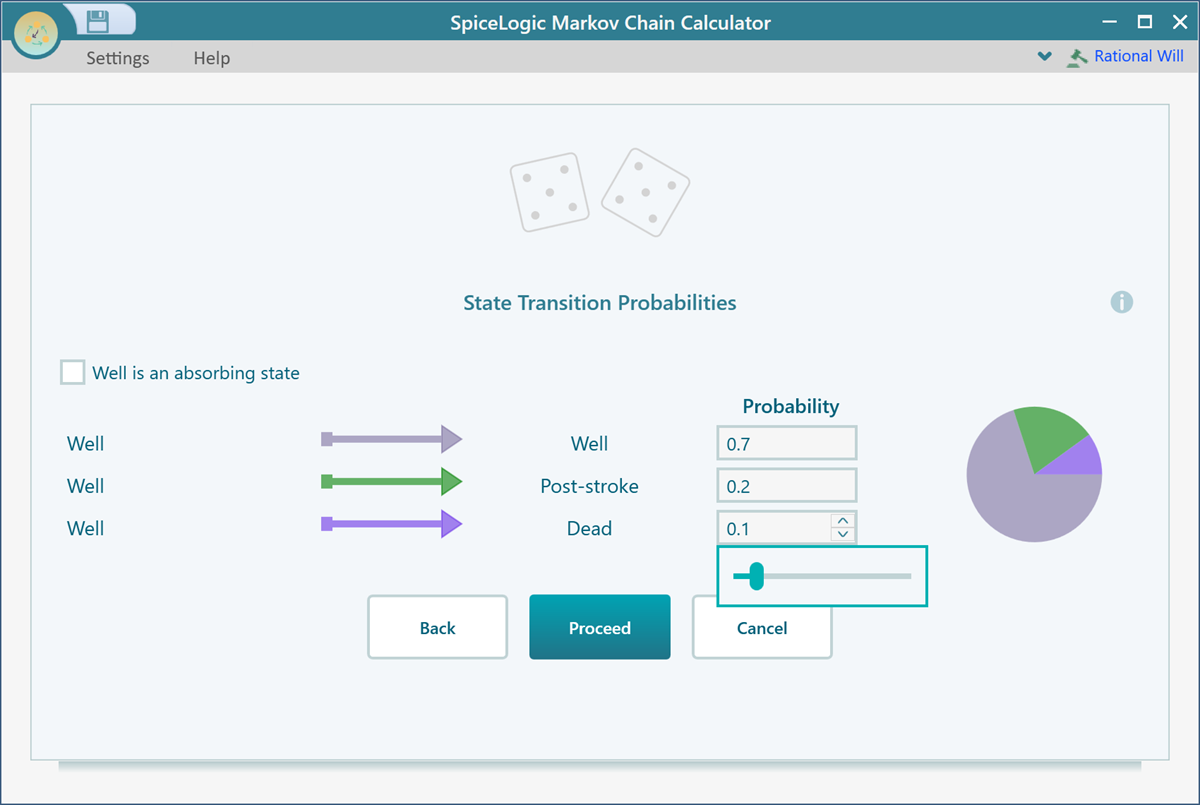
To describe the model, you give each possible move a transition probability. A transition probability is the chance of going from one state to another in a single step. For the state "Well", we will use these values:
- "Well" to "Well" => 0.9
- "Well" to "Post-stroke" => 0.2
- "Well" to "Dead" => 0.1
From the "Post-stroke" state, we will use these:
- "Post-stroke" to "Dead" => 0.1
- "Post-stroke" to "Post-stroke" => 0.9
The "Dead" state is an absorbing state. Once the patient enters "Dead", they stay there and can never leave. Every Markov model needs at least one place where the process can settle. Here that place is "Dead".
Now let's build the model. Start the SpiceLogic Markov Chain Calculator software.
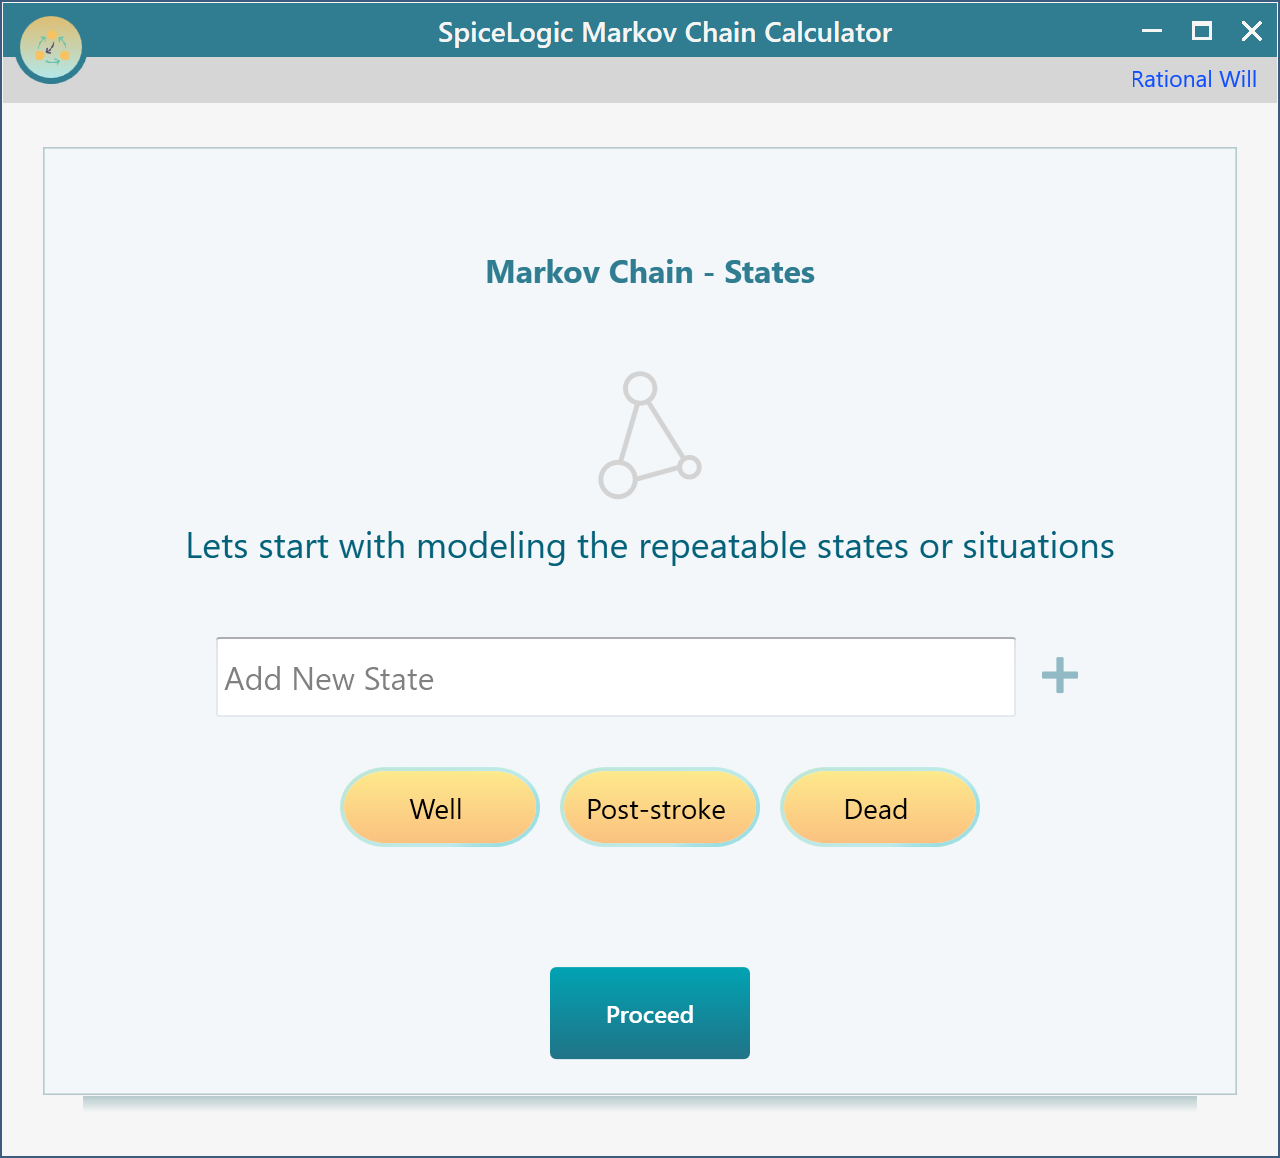
The first screen asks you to name your states. Type in the three state names for this model: "Well", "Post-stroke", and "Dead". These are just the situations the patient can be in. Enter them as shown below.
Setting Transition Probabilities
Click the Proceed button. The software now asks you to set the transition probabilities for the state "Well". These numbers tell the model how likely the patient is to move from "Well" into each of the other states in one step in time. Think of one step as one year passing. Set the probabilities as shown below.
Click Proceed. Next you set the transition probabilities for the state "Post-stroke", the same way you just did for "Well". Enter the values for "Post-stroke", then click Proceed.
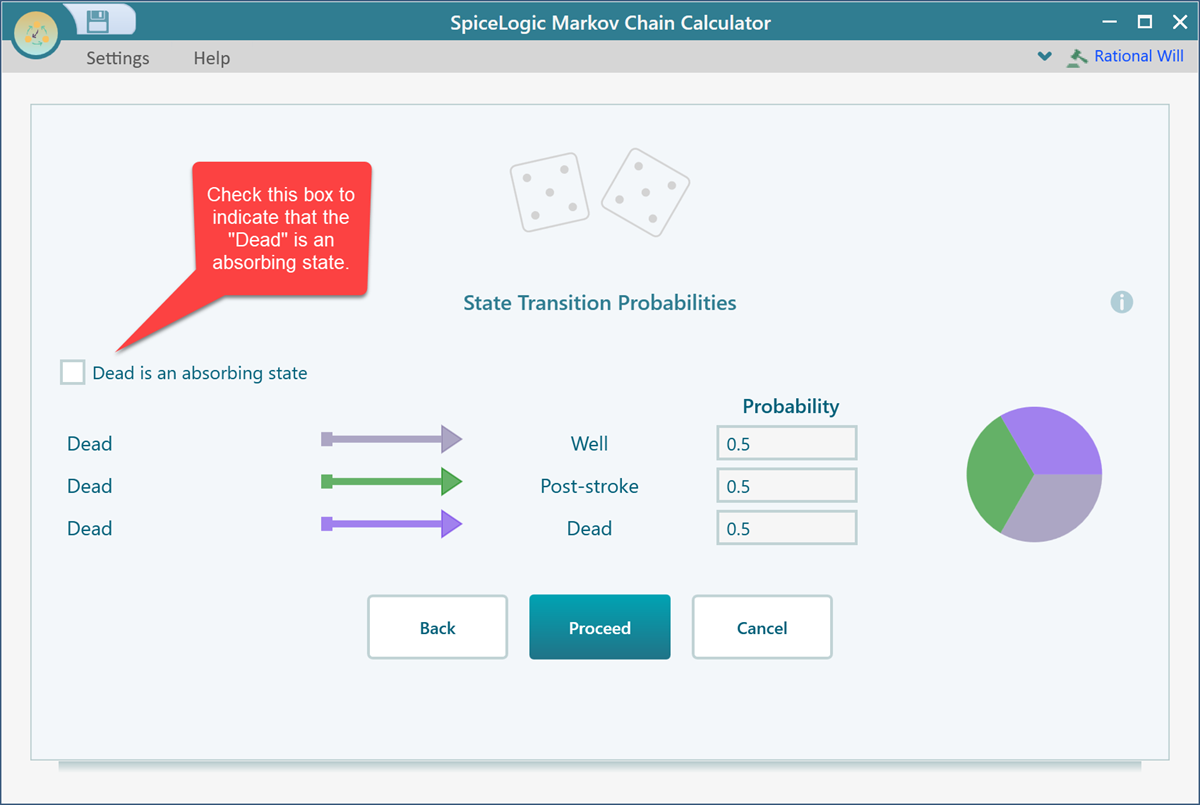
Now the software asks for the transition probabilities for the state "Dead". On this screen you will see a checkbox you can tick to mark the state as an absorbing state. A patient who has died cannot move to any other state, so "Dead" is absorbing. Check that box.
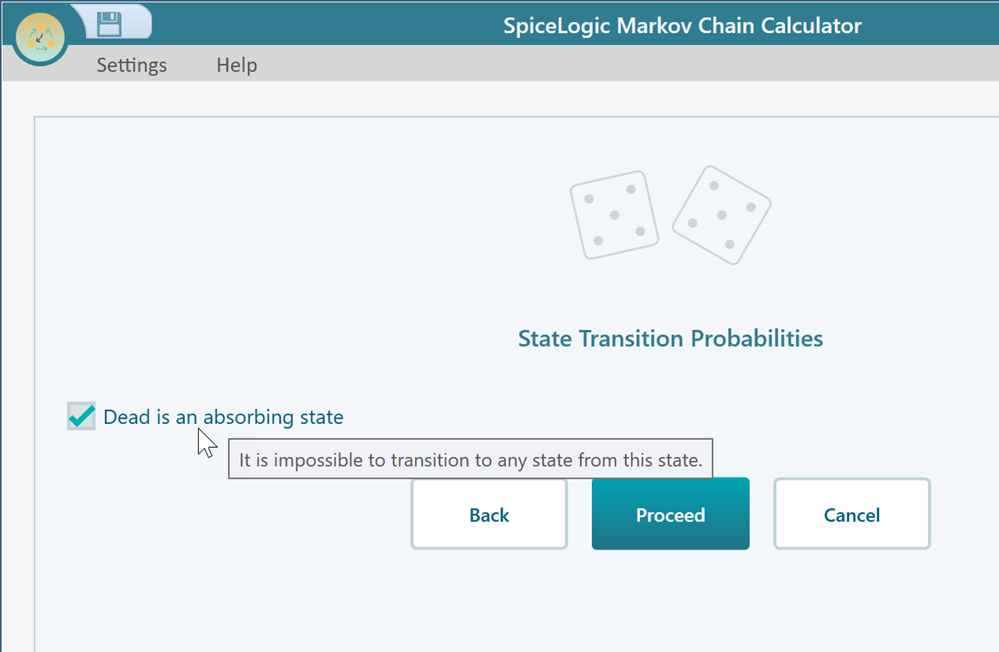
Once that box is checked, click Proceed. You will reach a screen telling you that you have finished setting up the Markov Chain. Click the Finish button and the software takes you to the view shown below.
Analyzing the Result
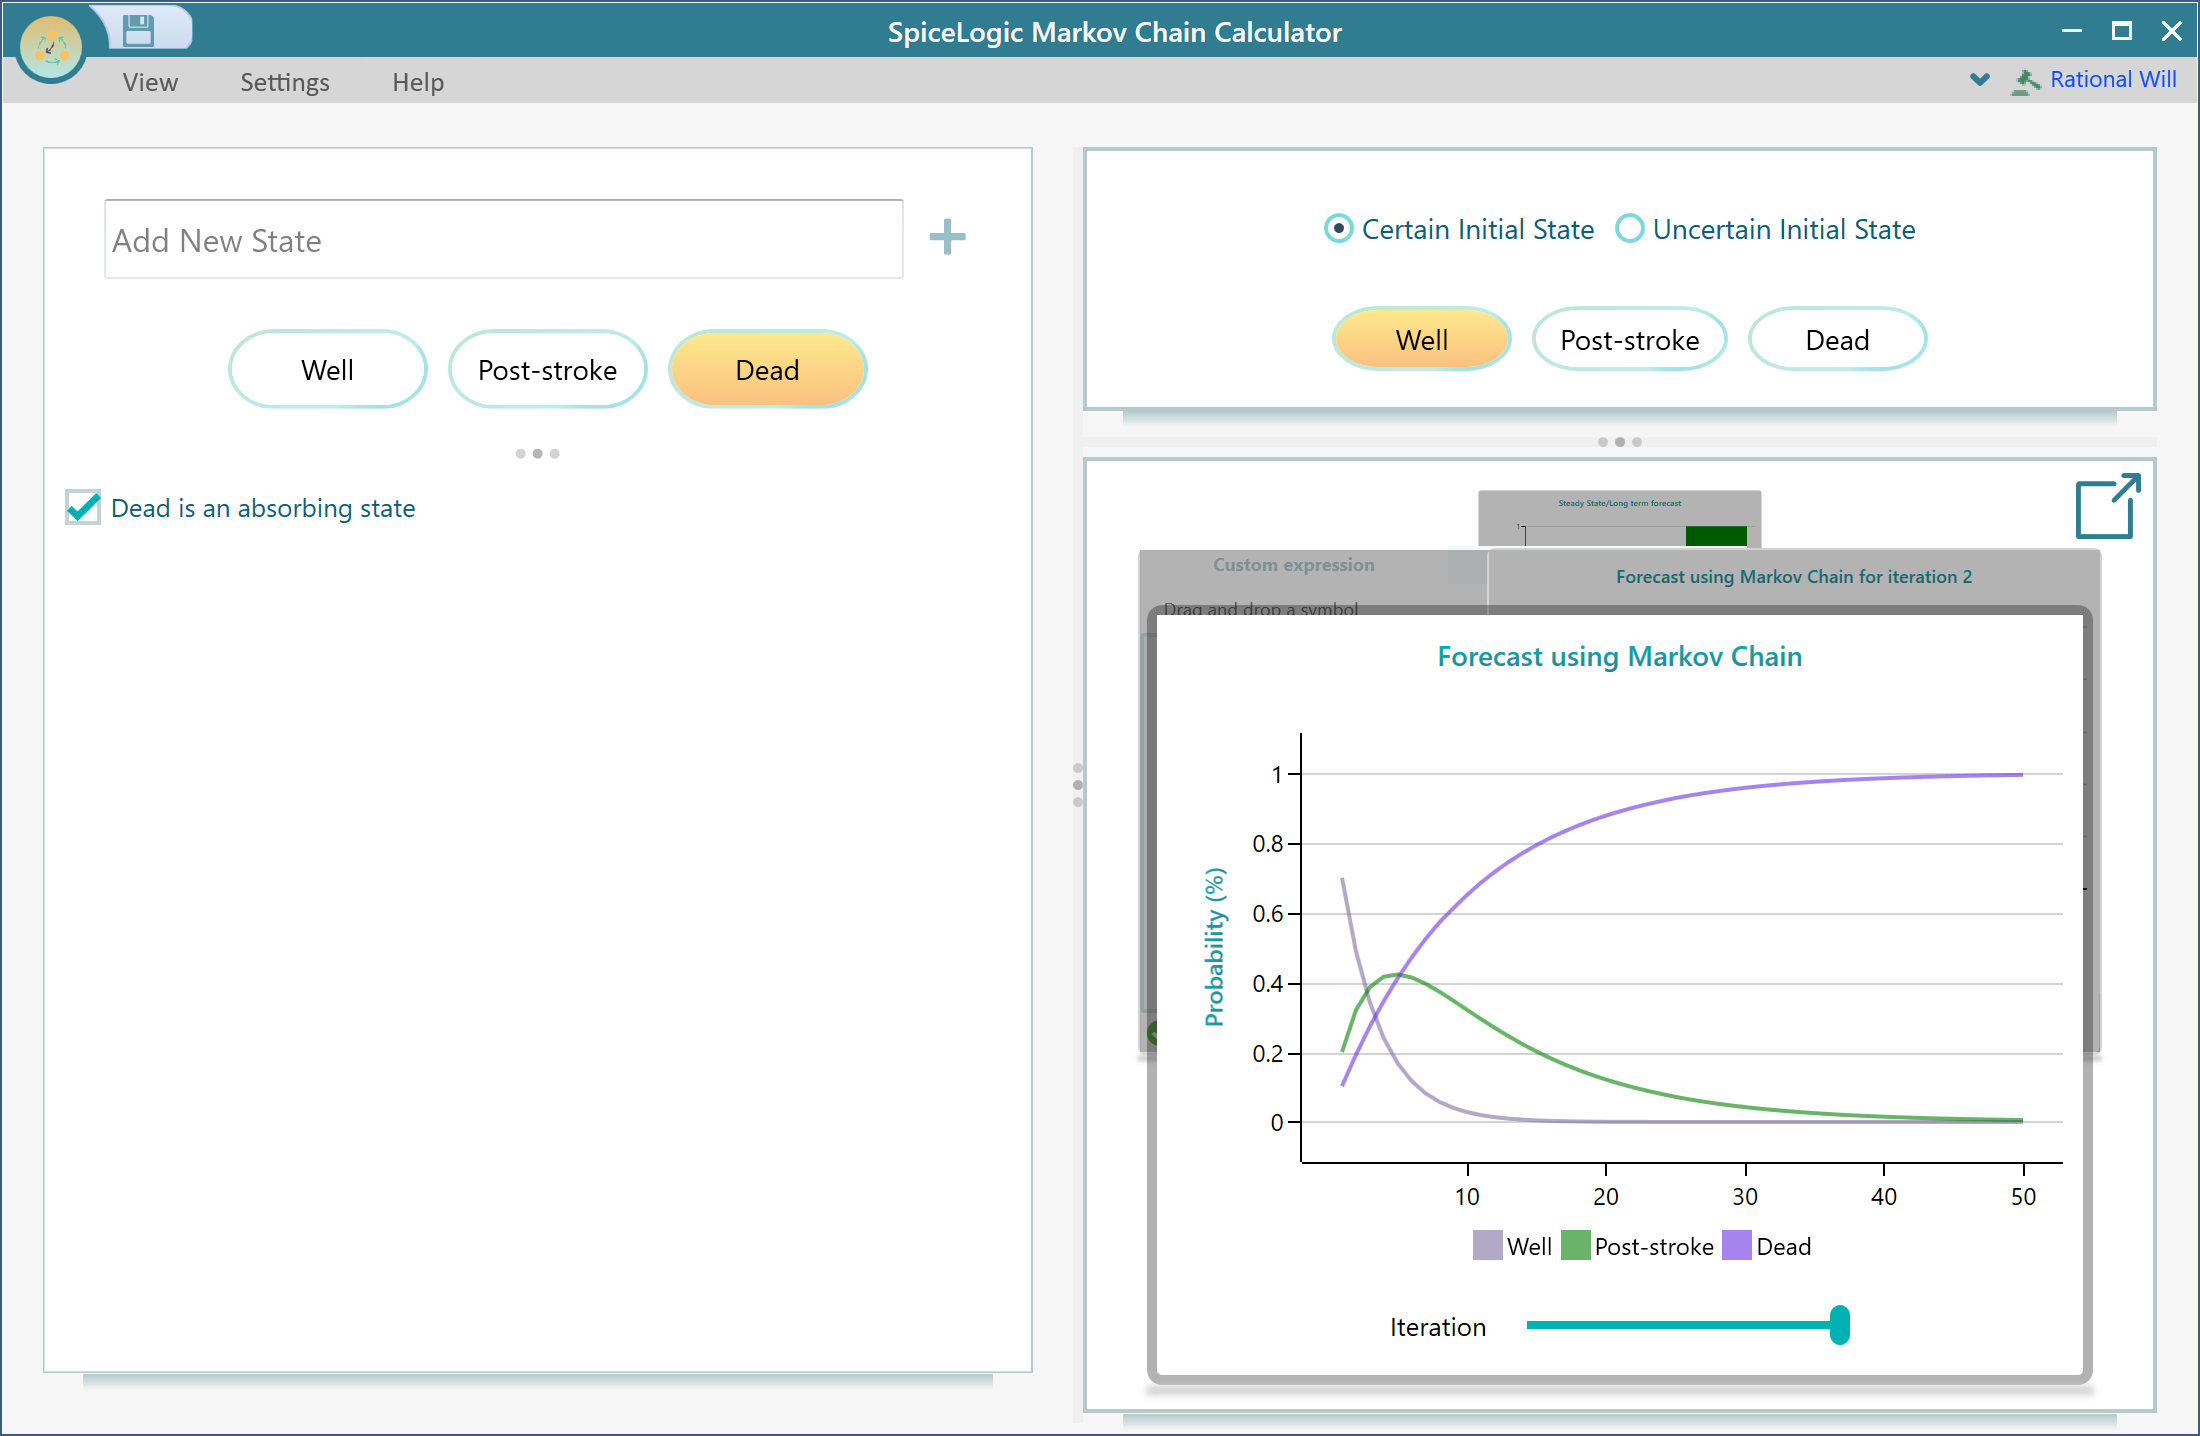
First, pick which state the patient starts in. This is the Initial State. By default the first state is selected, which in this model is "Well". That is exactly what we want here, since we are following a healthy patient over time. In a different model you might want a different starting point. Just select the state that matches where your process begins. For example, if you were studying patients who already had a stroke, you would pick "Post-stroke" instead.
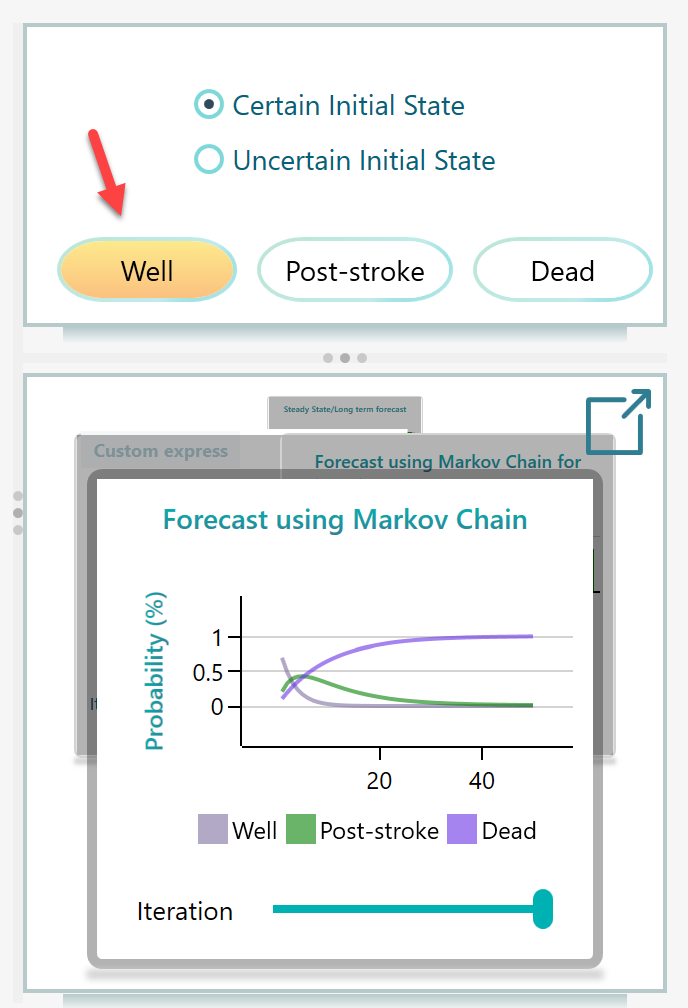
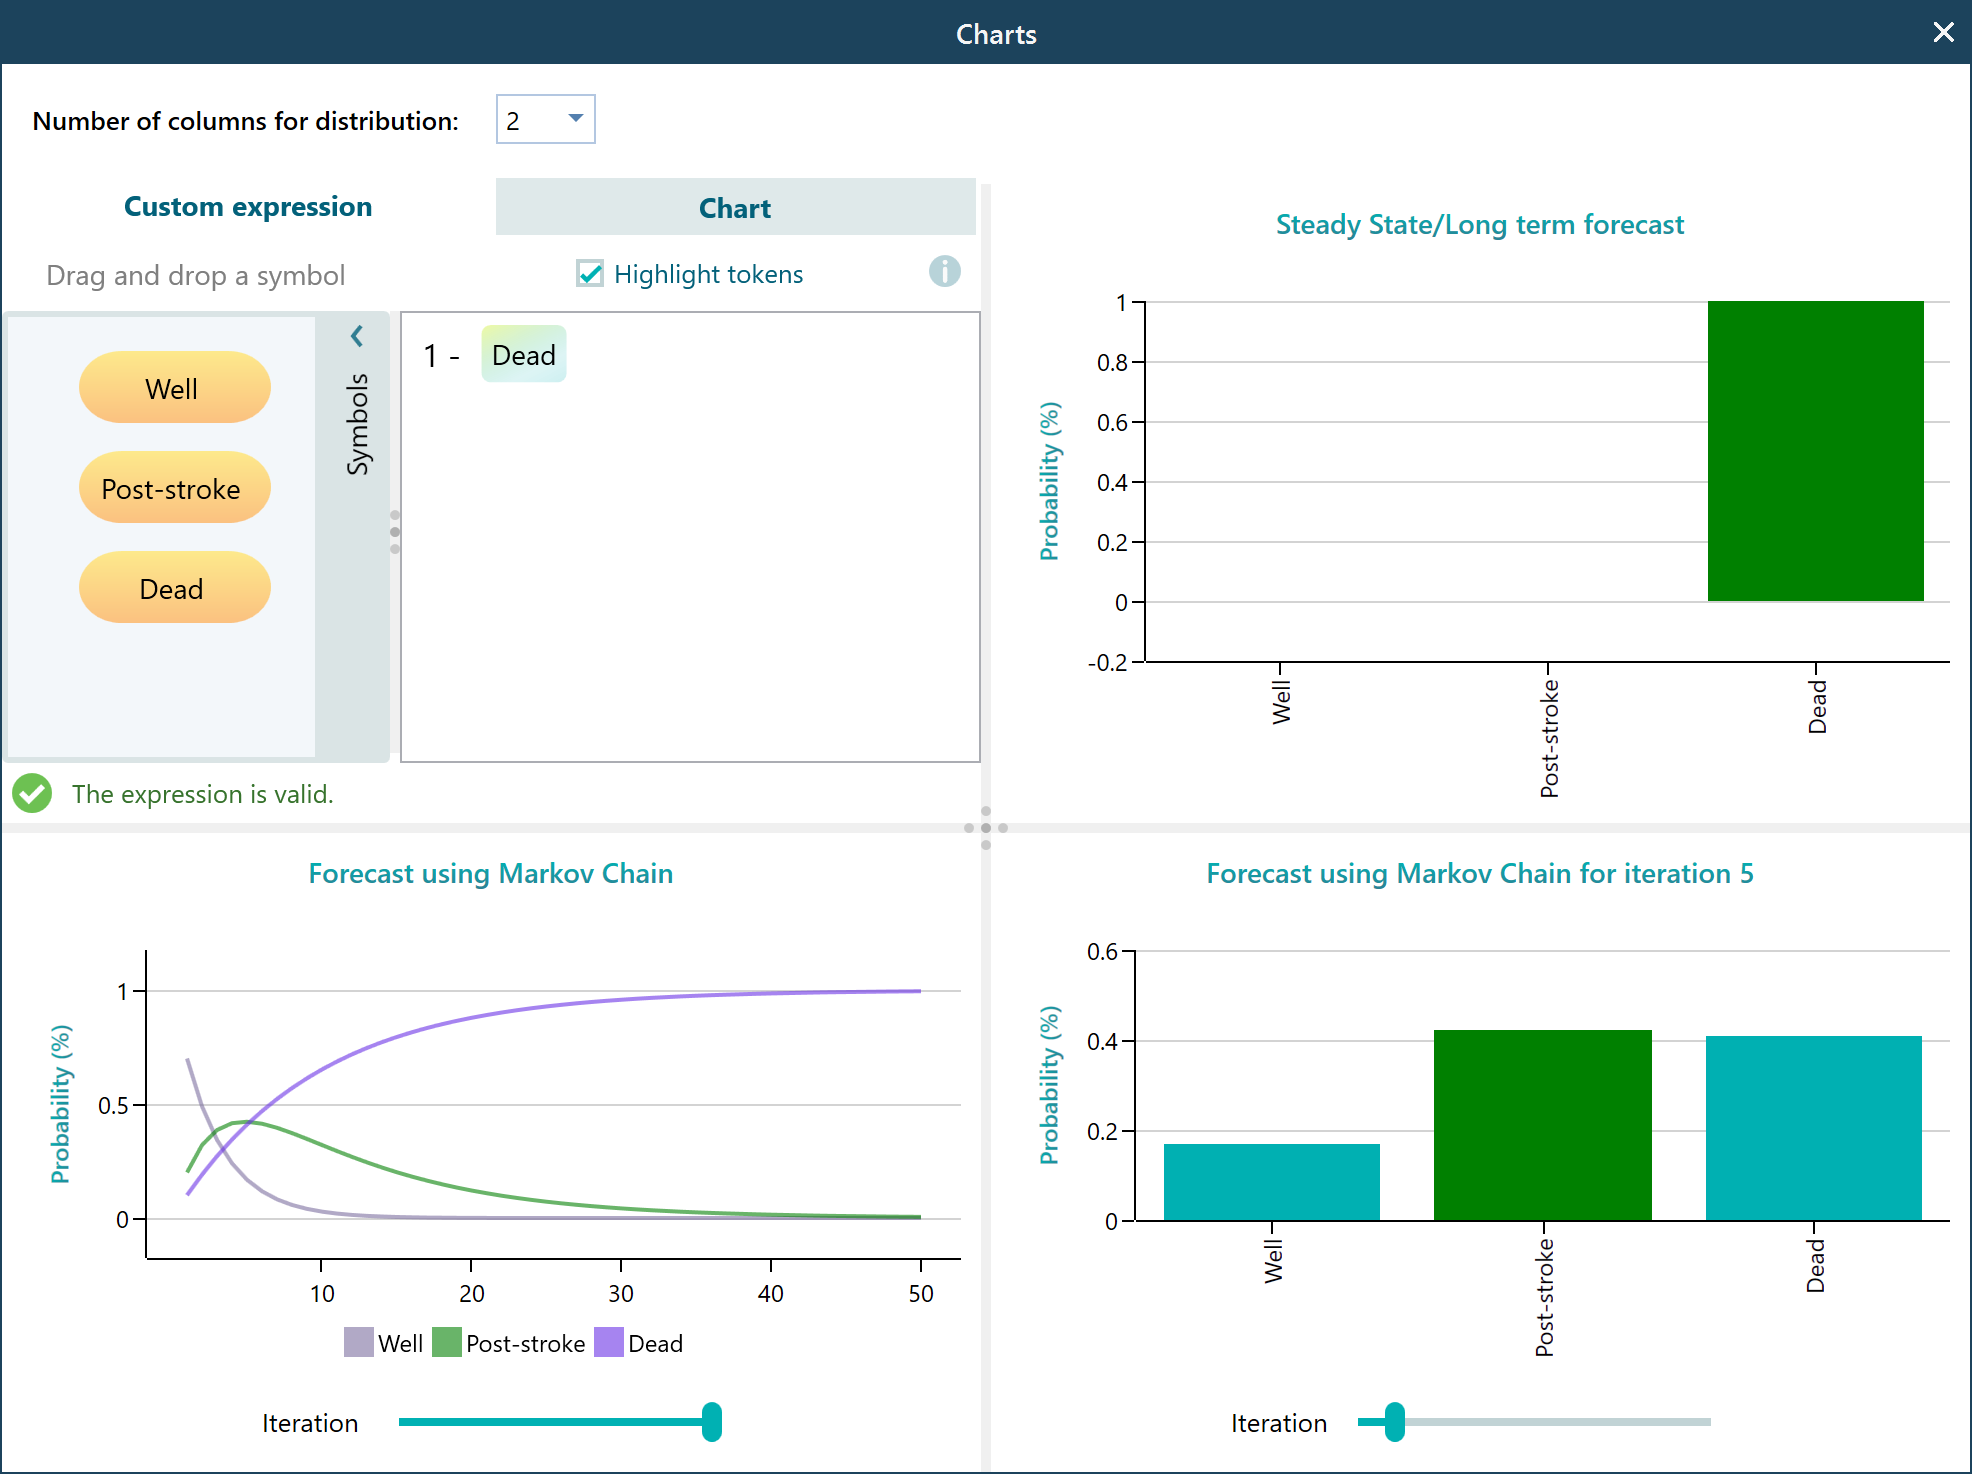
You can change the iteration number to a higher value, such as 50, to get a smoother curve like the one above. The iteration number is just how many time steps the model runs forward. A larger number traces the patient further into the future and shows the trend more clearly. If one step is a year, then 50 iterations follows the patient over 50 years. To see any of these charts on its own at a larger size, click the Pop-out button in the top right corner of the chart carousel.
Viewing the data table and exporting to Excel
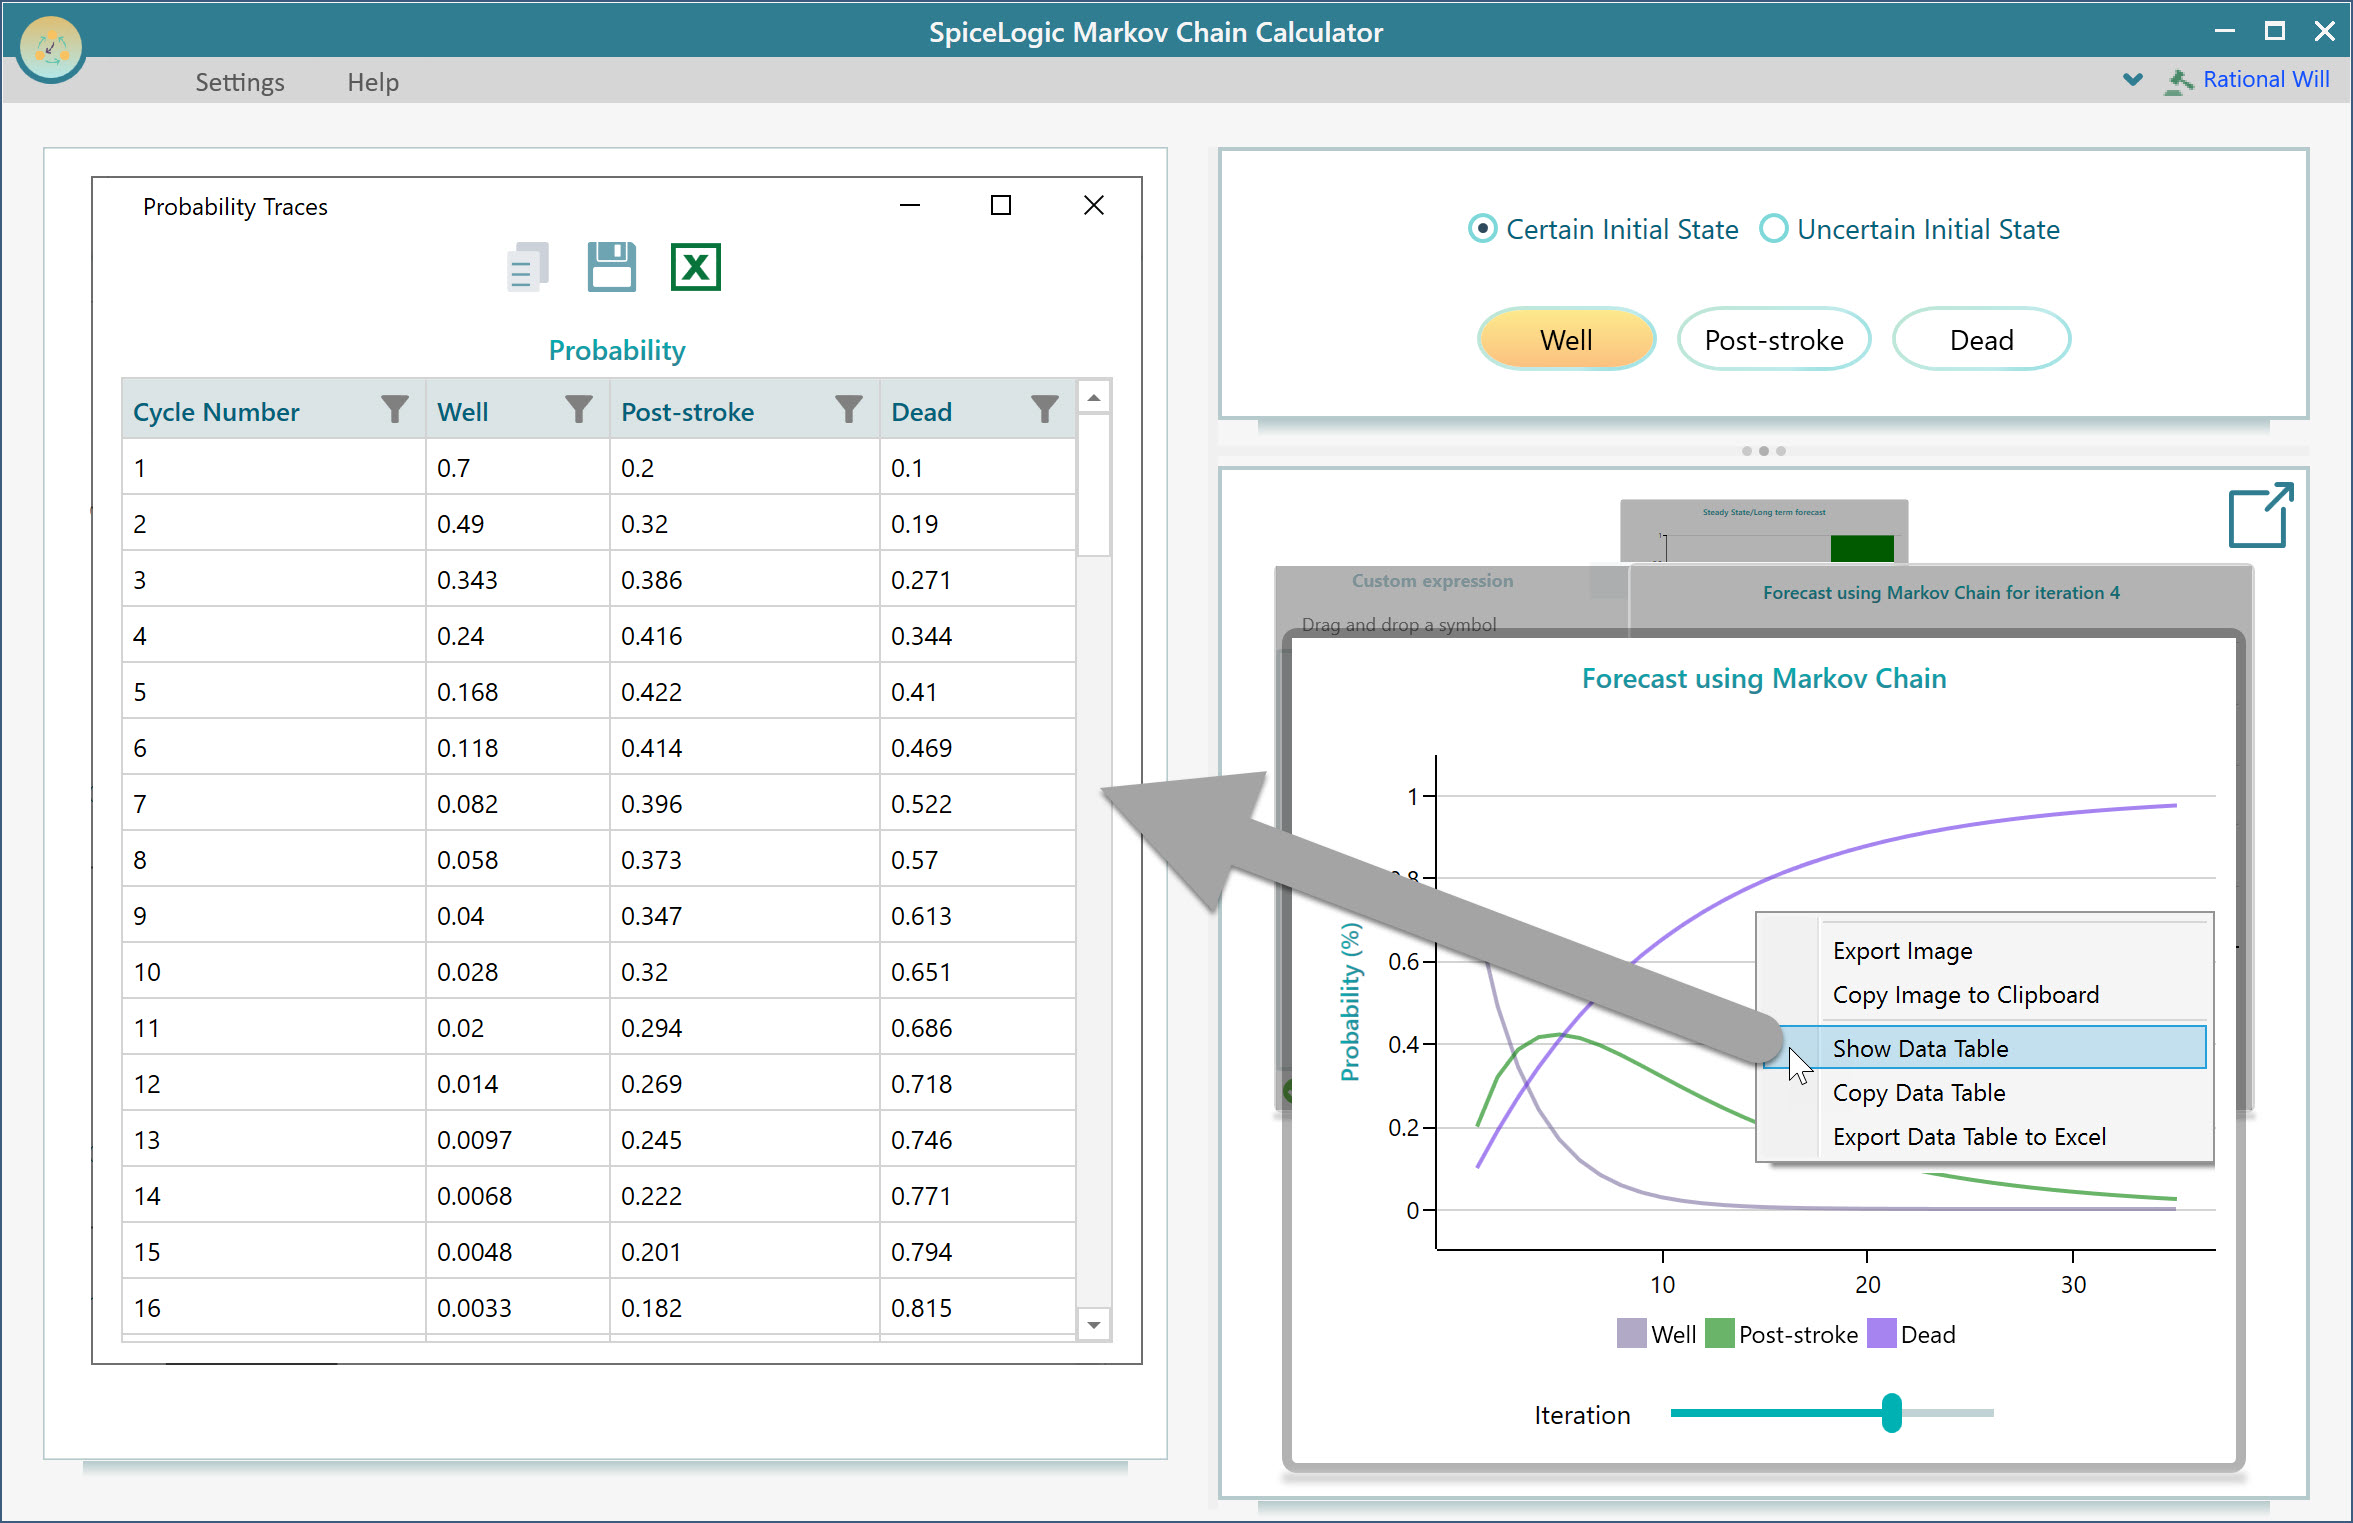
Sometimes you want the actual numbers behind a chart, not just the picture. You can get them easily. Right-click on any chart and you will find options to copy the chart image, copy the table data, view the data table, and export the data table to Excel. This is handy when you need to drop the results into a report, or do more work on them in a spreadsheet. For example, you could pull the year-by-year probabilities into Excel and chart them next to results from another model. The example below shows the data table behind the Probability forecast chart.
Calculating a custom state with a custom expression (for example, Survival probability)
You may want to trace a value that is not one of your states directly, such as Survival probability. Survival probability is just the chance the patient is still alive. That is 1 minus the probability of being in the "Dead" state. So if the model says there is a 0.3 chance of being "Dead" at some step, the survival probability at that step is 0.7. The chart carousel includes a custom expression calculator for exactly this kind of thing. Drag and drop a state name into the calculator and type your math expression. The expression for Survival probability is shown below.
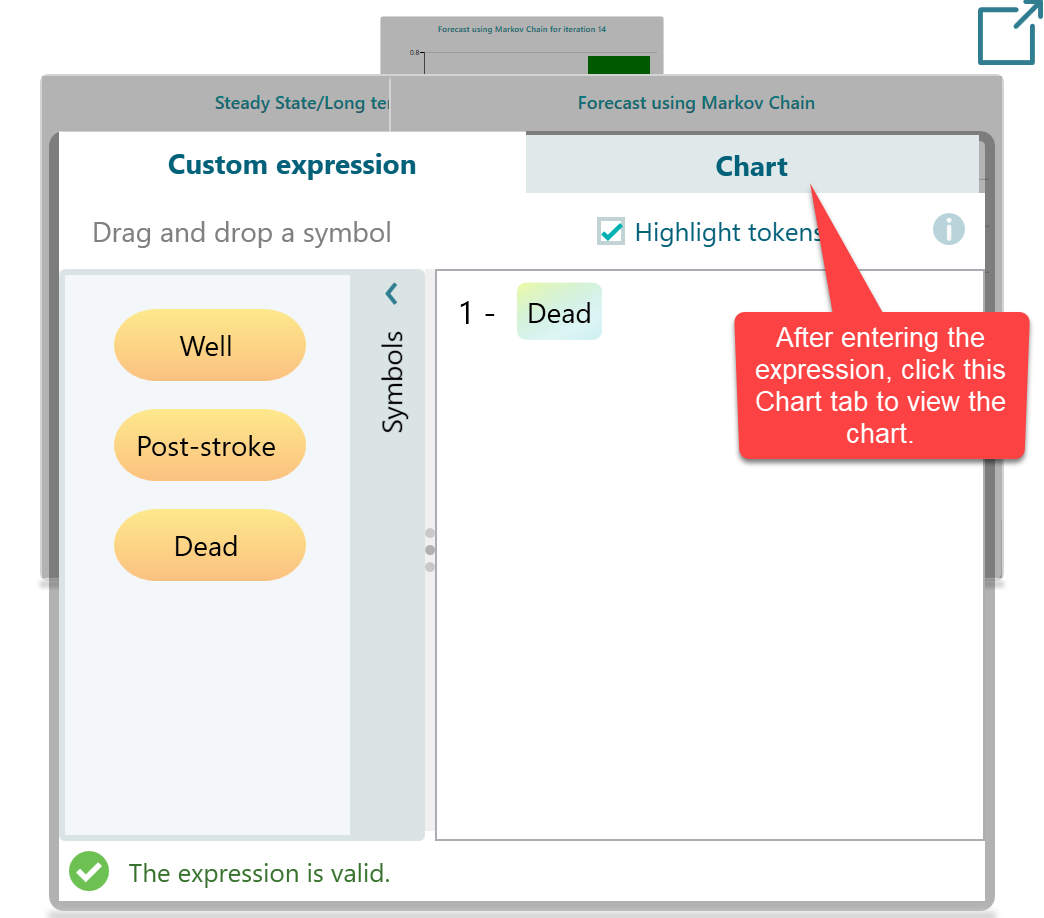
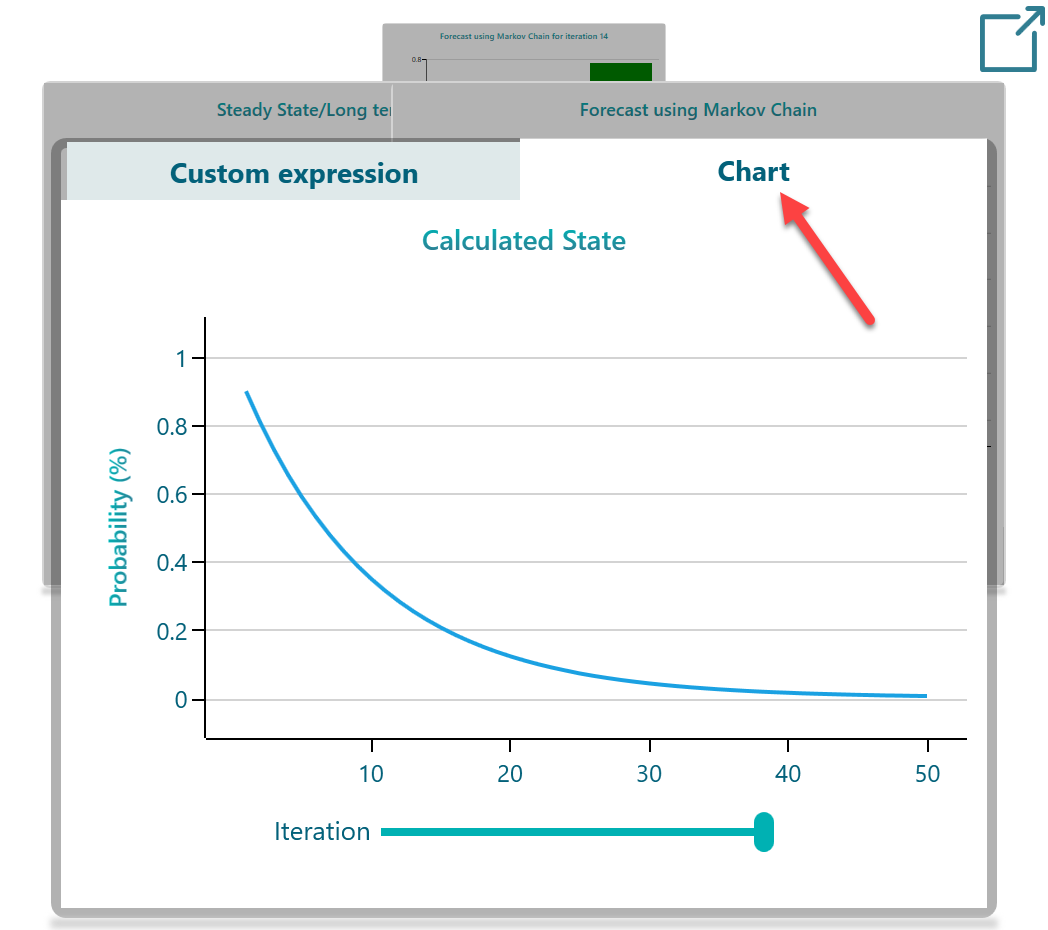
Switch to the Chart tab and you will see the chart for Survival probability, drawn from the expression you just entered.
Viewing the graph
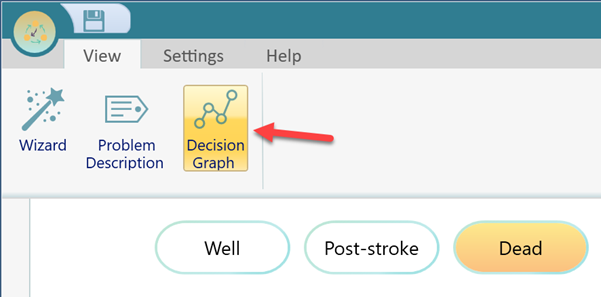
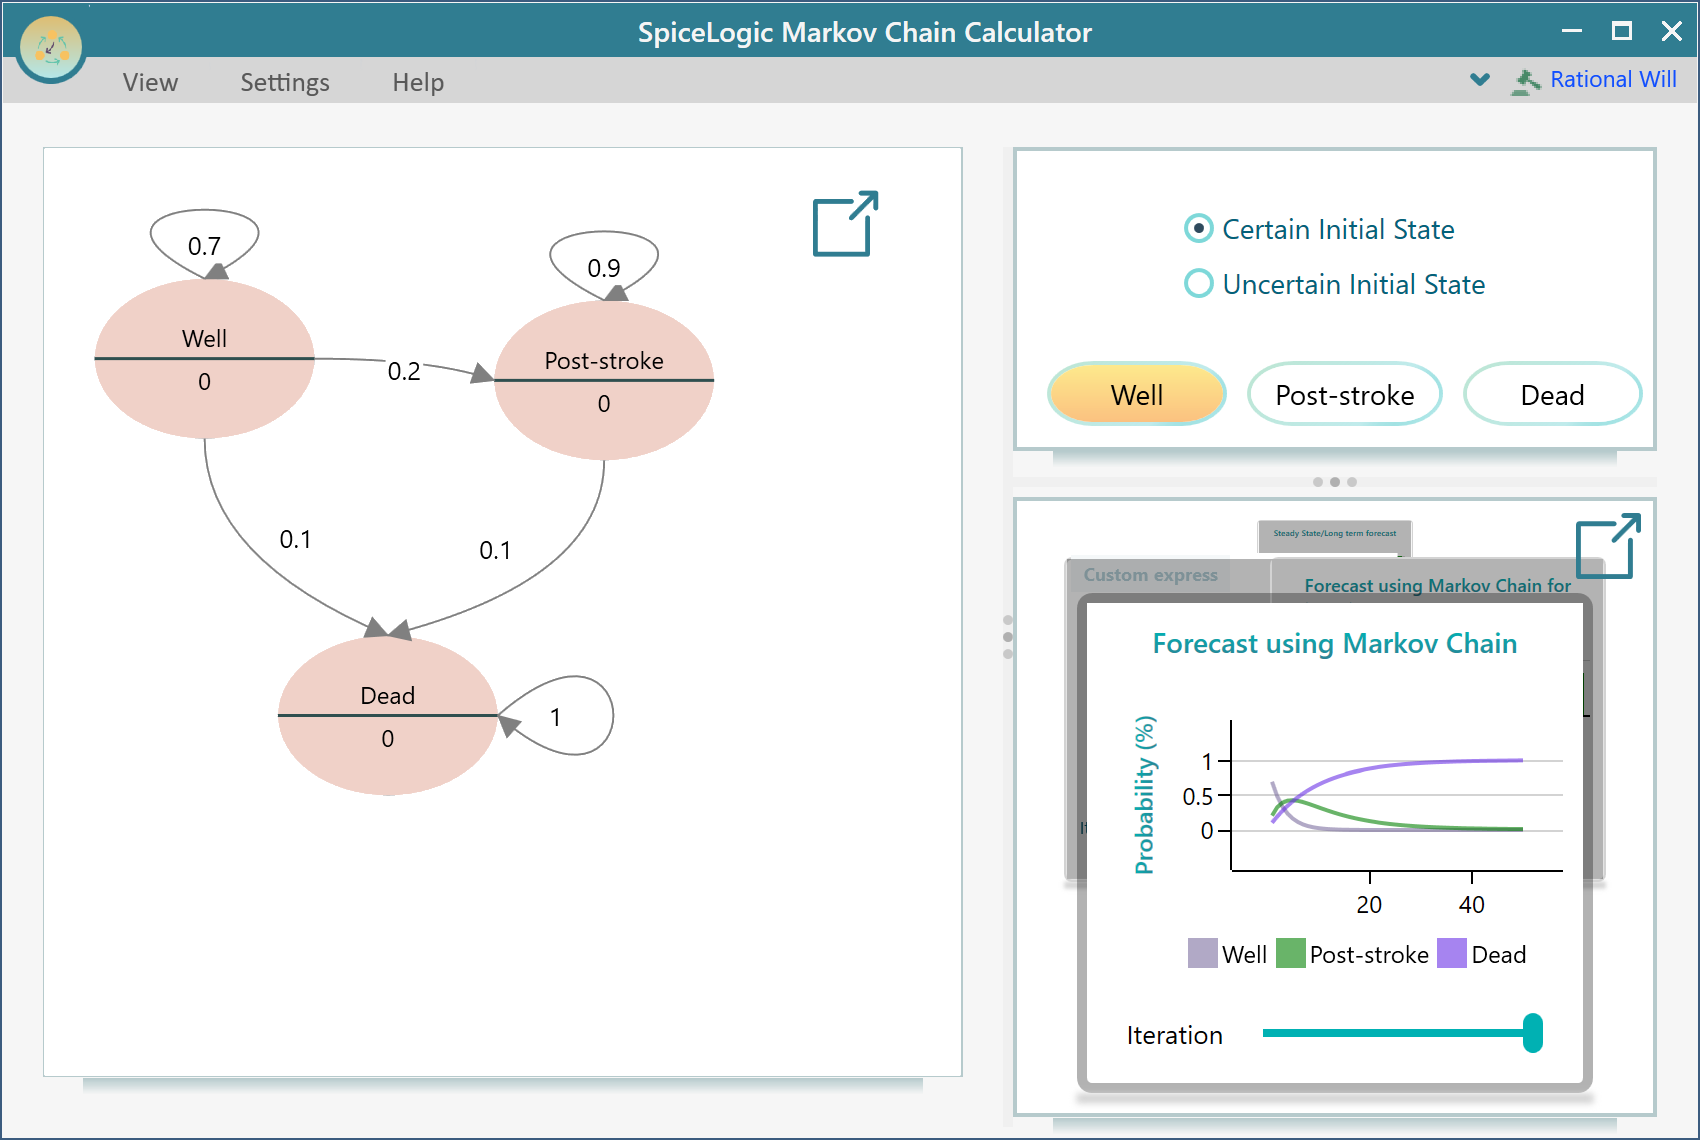
The View menu has a button named "Decision Graph". Click it to see this model drawn as a cyclic graph. Each state shows up as a node, and the transitions between them show up as arrows. Seeing the model laid out this way makes it easy to check your work. You can quickly confirm that every state connects to the right neighbors, and that no arrow is pointing somewhere it should not.
After you click that button, you will see a view like the one below. You can drag the nodes around and reposition them to make the layout cleaner and easier to read, as shown here.
Setting a Reward on a state to calculate Expected Life Years
The Markov Chain Calculator is free software from SpiceLogic, and it is built for probability analysis only. If you need to go further, take a look at our flagship decision analysis software Rational Will. For example, you might want to assign a reward or utility value to a state and run an expected utility analysis, or work out life expectancy. As an example, here is the documentation showing how to set a time-variant probability and a state reward to calculate life expectancy.