


Results and Charts
SpiceLogic AHP Software includes several visual reports. The software shows priorities, option attributes, weighted attributes, radar charts, and sensitivity charts so you can understand the result instead of only seeing a final number.
Criteria Weight Results
The first chart carousel appears in the Pairwise Comparison panel.
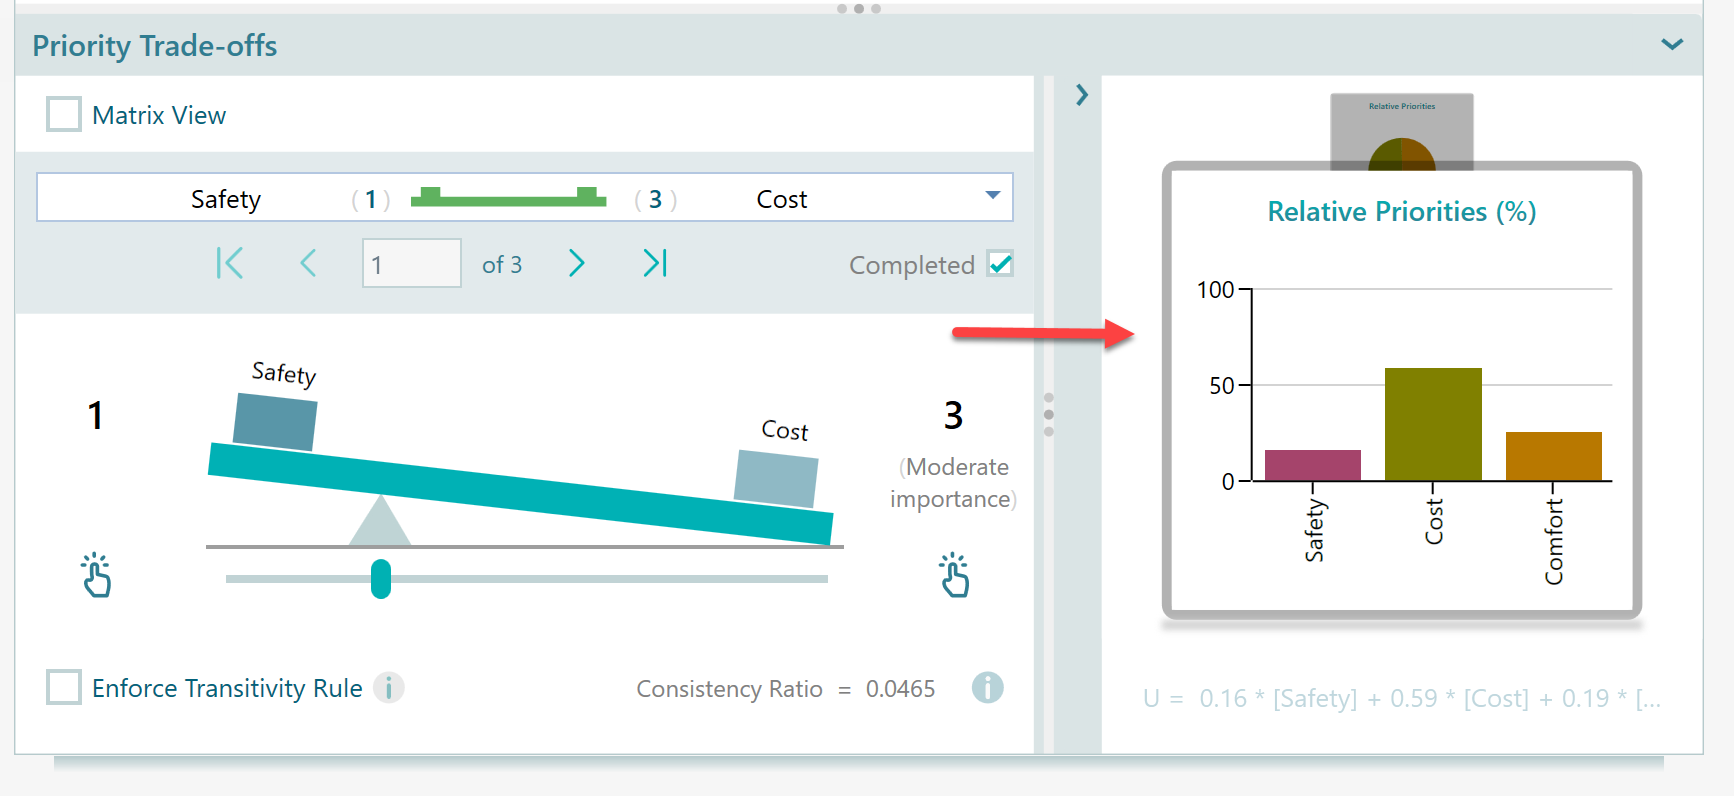
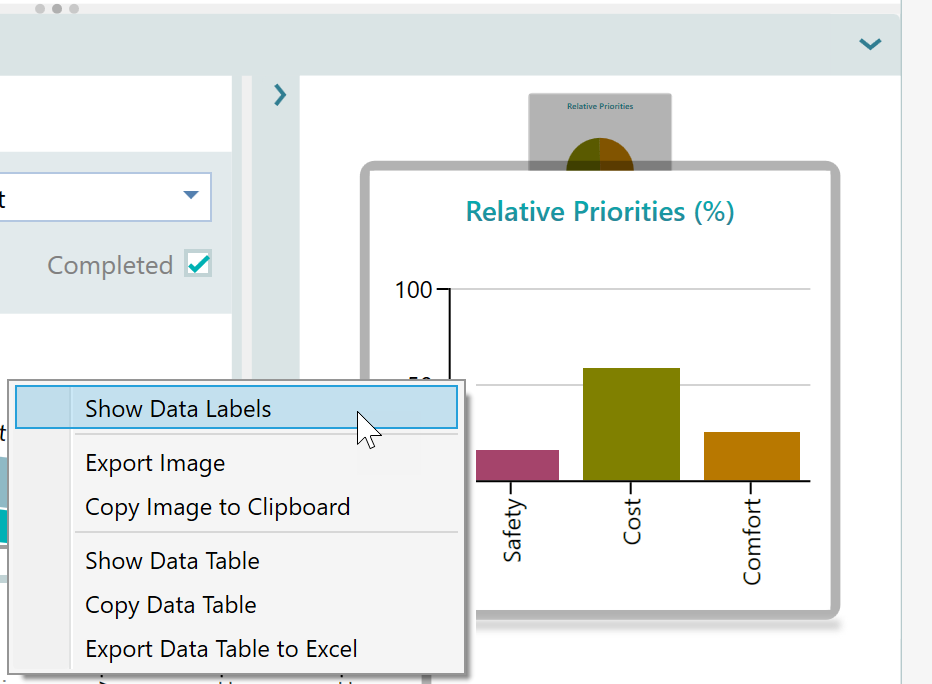
Right-click a chart to open options such as showing data labels, copying the chart to the clipboard, viewing the data table, or exporting the data table to Excel.
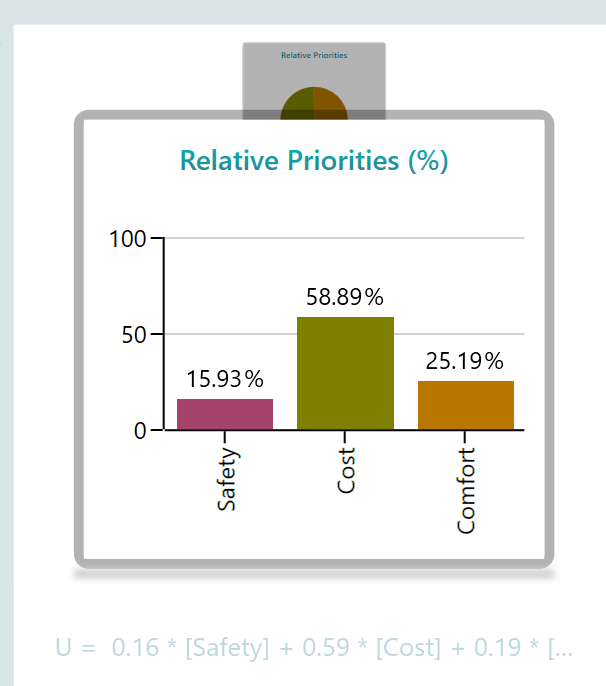
After you enable data labels, the chart displays the numeric values above the columns.
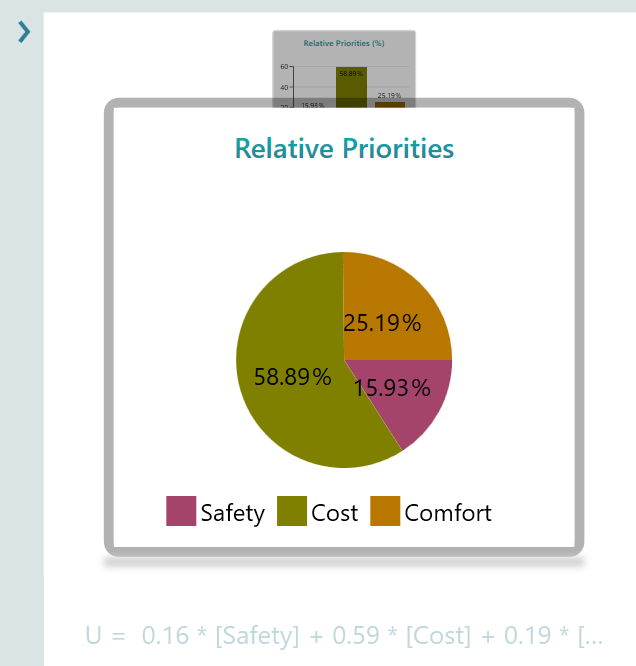
In the same carousel, you can also view the priority distribution as a pie chart.
By default, data labels are hidden so charts stay clean. When you need exact numbers, turn the labels on from the chart menu.
Option Results
Click an option in the left vertical menu to see that option's criteria attribute distribution.
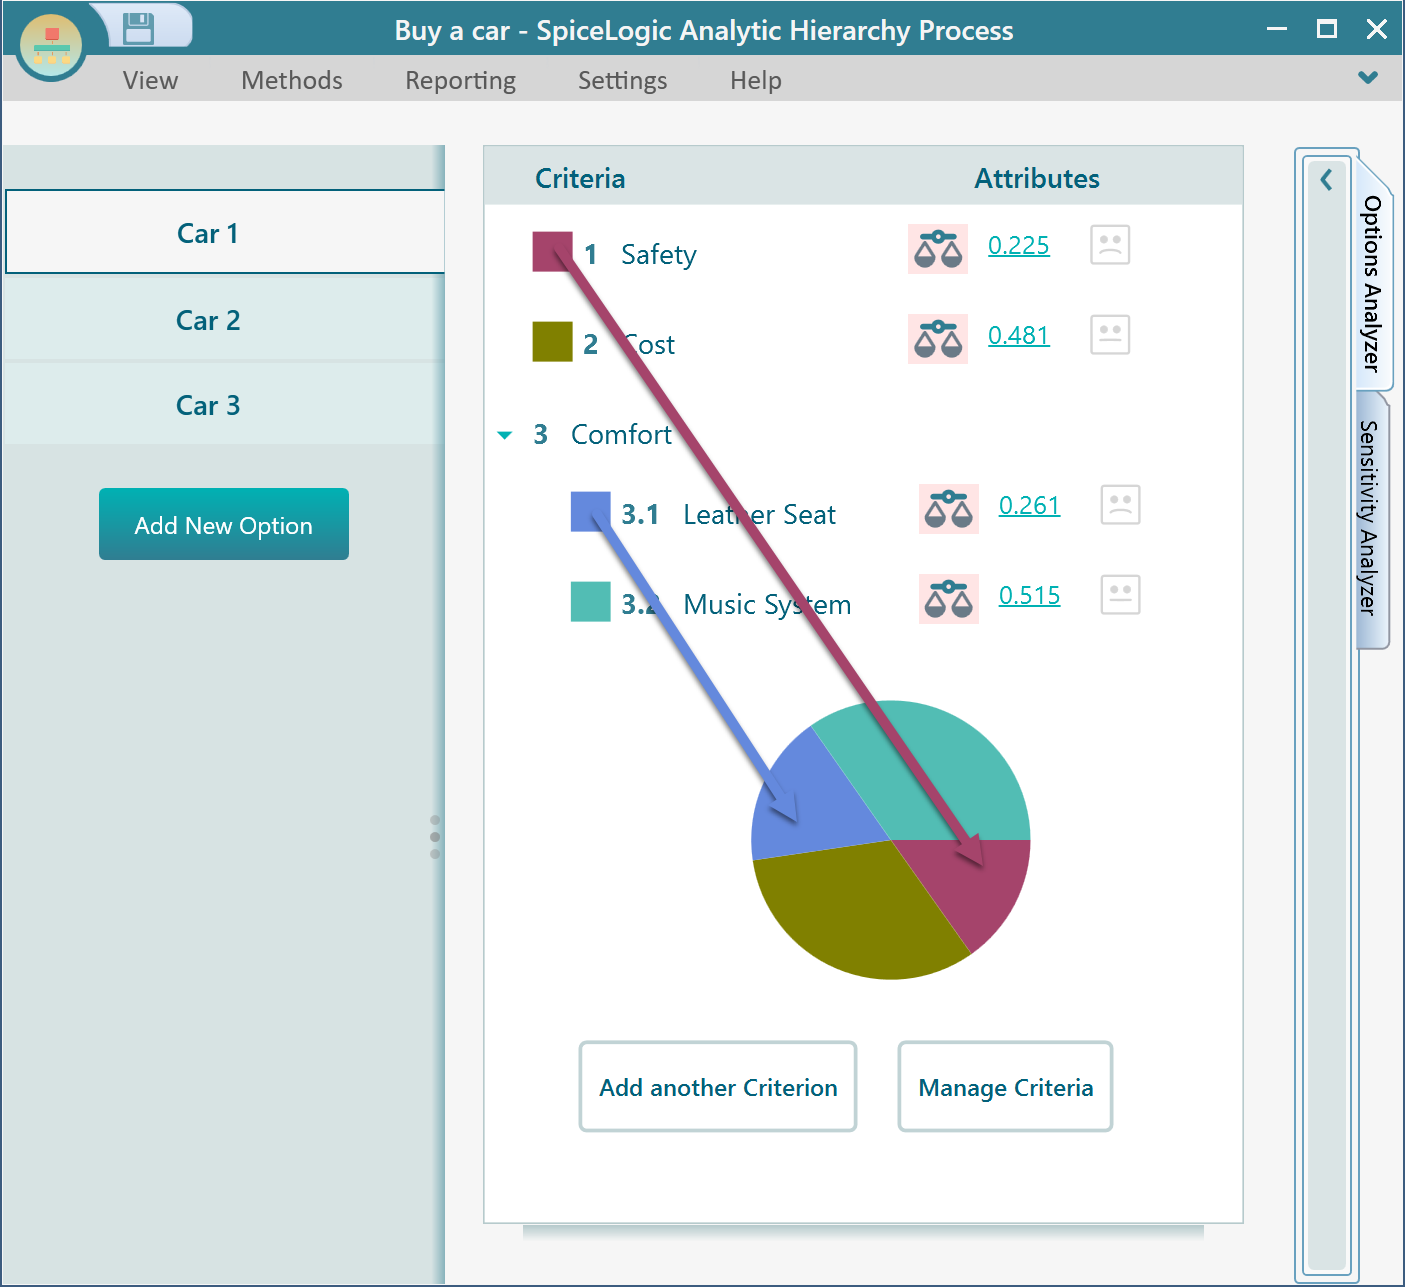
For "Car 1", each criterion attribute is shown on the page. The pie chart shows the relative distribution of those attributes. The pie colors match the boxes beside the criterion names.
Overall Decision Results
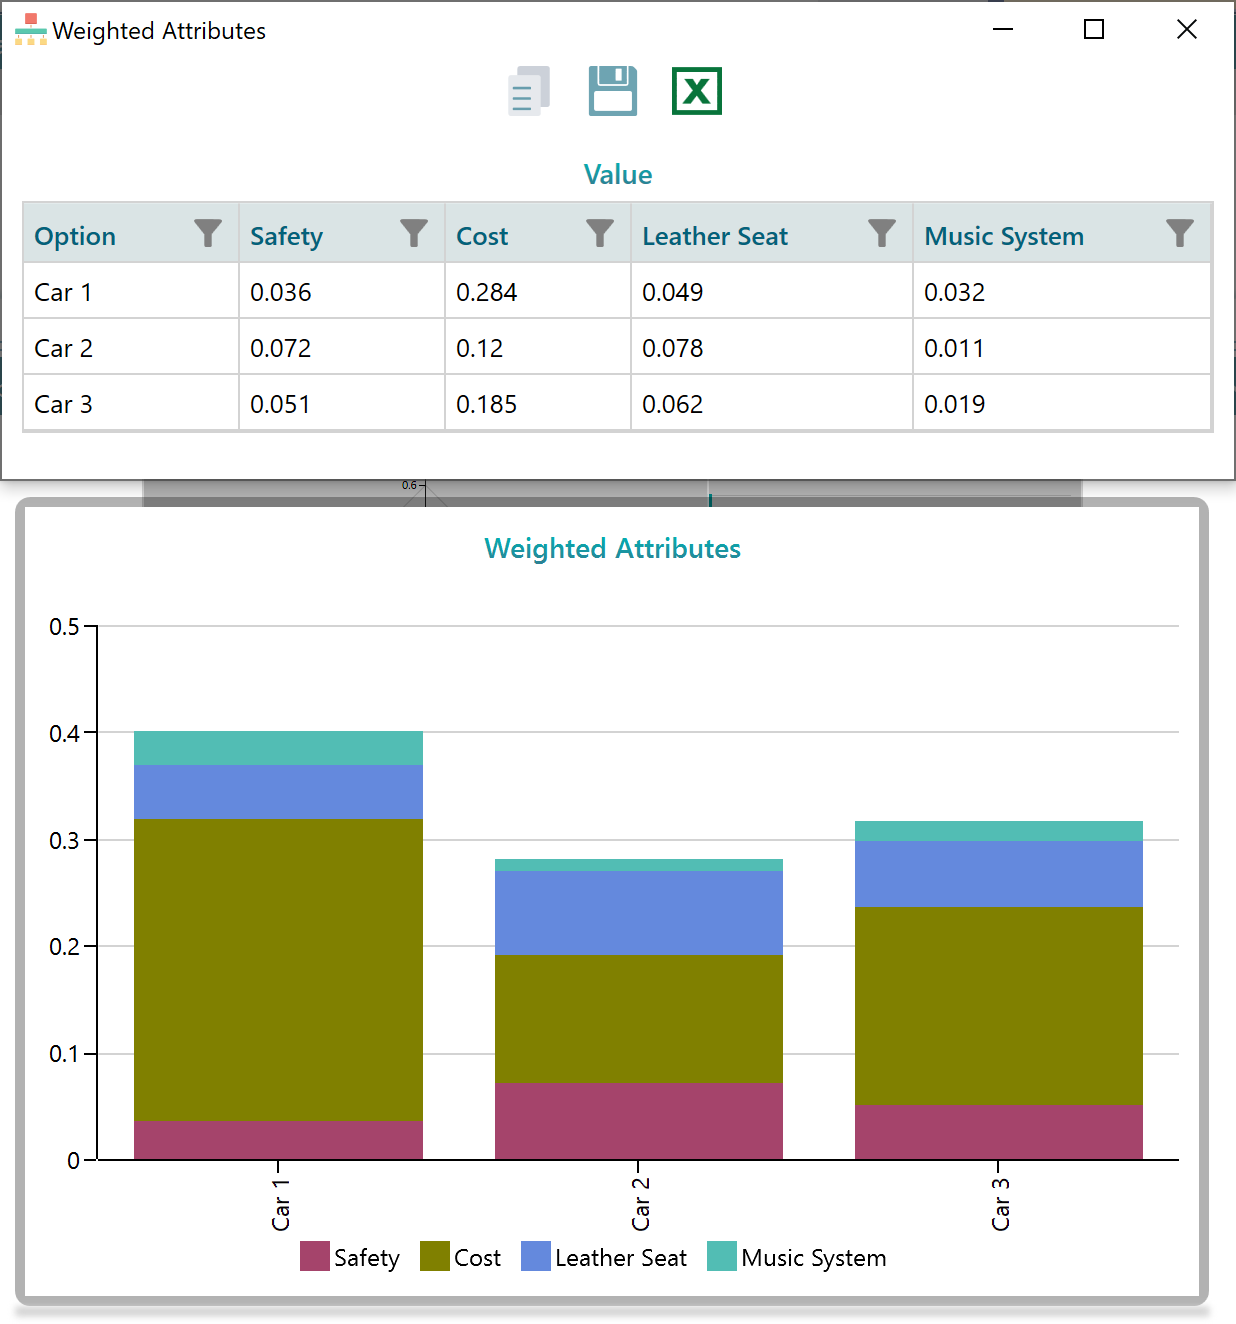
After the AHP model is complete, the Options Analyzer panel shows another chart carousel. It includes useful charts such as Priorities, Attributes Radar Chart, and Weighted Attributes.
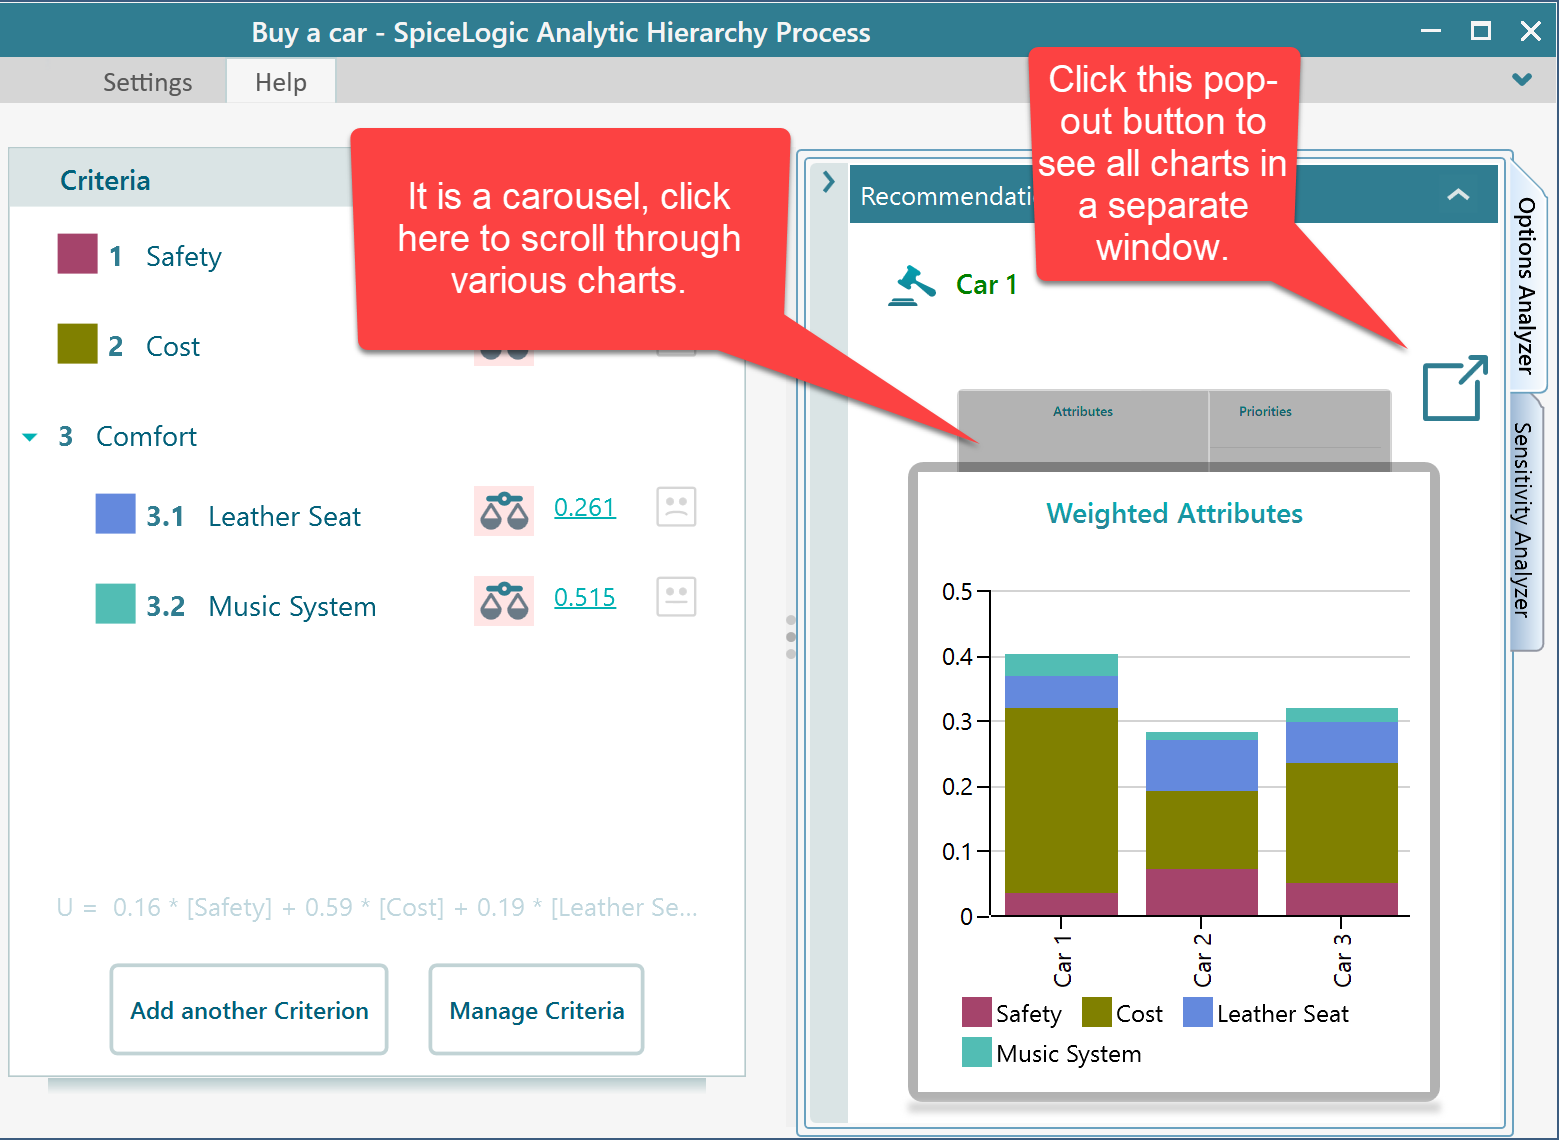
Click the pop-out button to open all charts in a separate window.
The Weighted Attributes chart is especially useful for sensitivity thinking. You can click a legend to hide one criterion and see how the overall result changes without that criterion.
For example, Cost has a strong effect on the result in this model. If you click the Cost legend to hide it, you can immediately see which option would be preferred if cost were ignored.
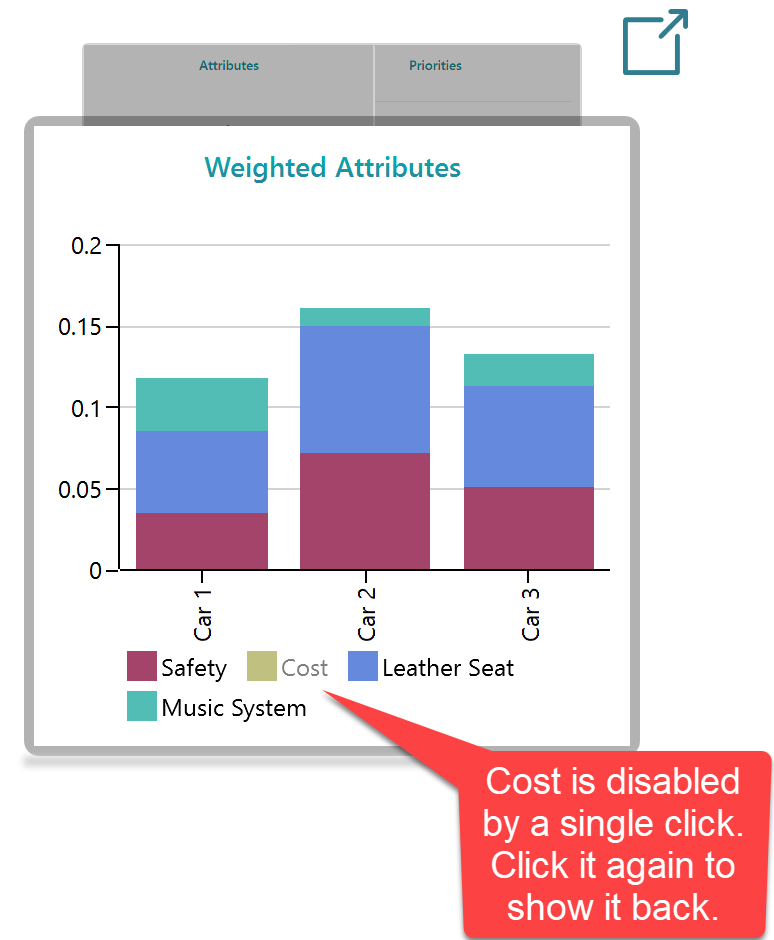
After Cost is temporarily hidden, "Car 2" becomes the best choice instead of "Car 1". With Cost included, "Car 1" was the best choice. This is a simple way to see how strongly one criterion affects the final decision.
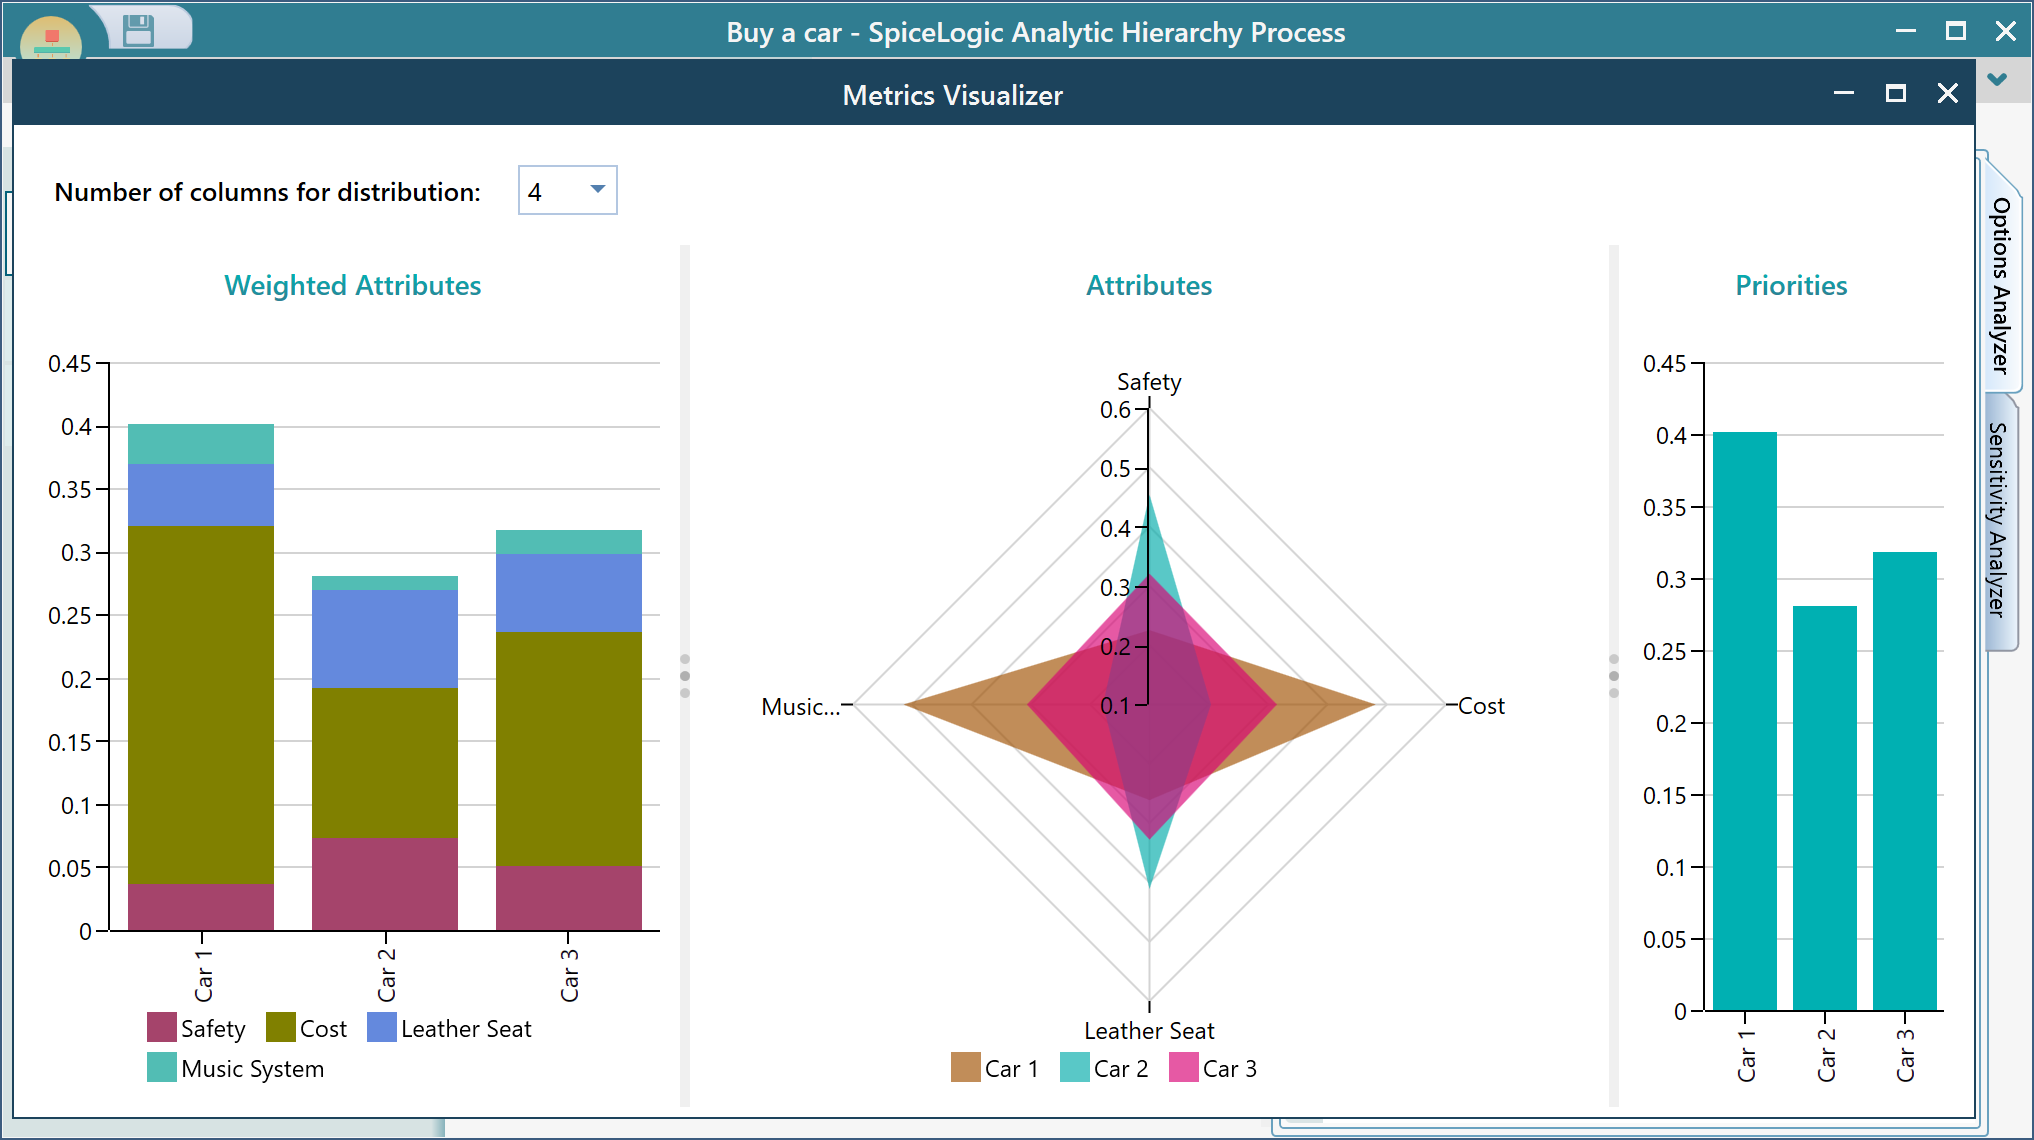
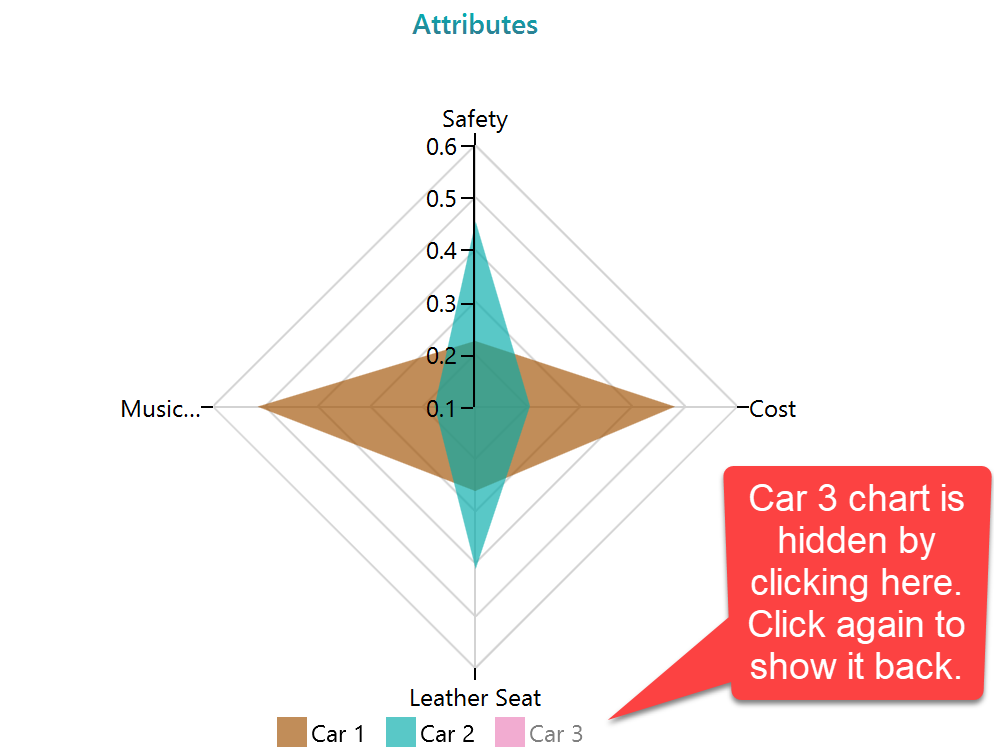
The Attribute Radar Chart shows the criterion attributes for each option. If the chart becomes crowded, click an option legend to hide that option and make the remaining options easier to compare.
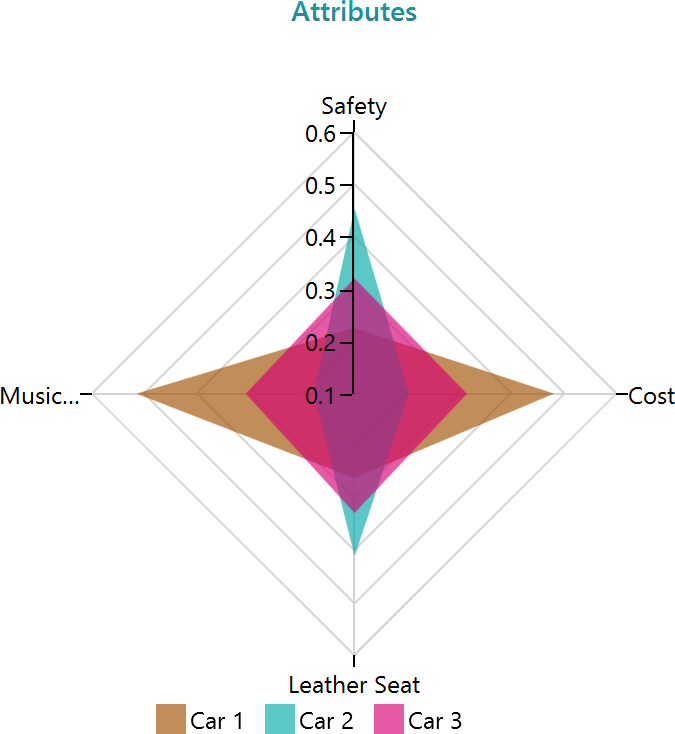
For example, if you are not interested in "Car 3", hide it by clicking its legend. The other two options become easier to read.
The Priority Chart is a simple column chart showing the final weighted score for each option. This is usually the main chart to check when you want to see the recommended option.
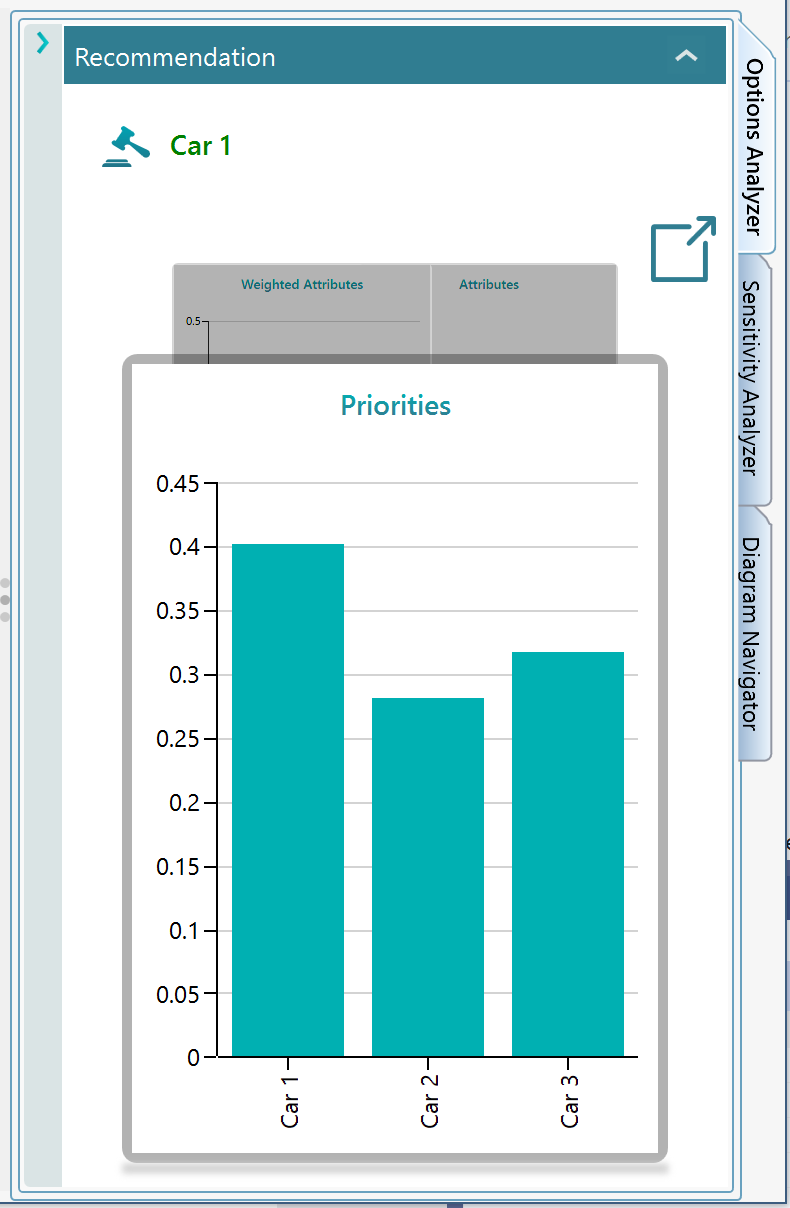
Chart Features
Every chart in the application has a common set of tools. You can show data labels, show a data table, export the data to Excel, copy the data to the clipboard as CSV, copy the chart image, or save the chart as PNG or JPG. Right-click a chart to see the available commands.
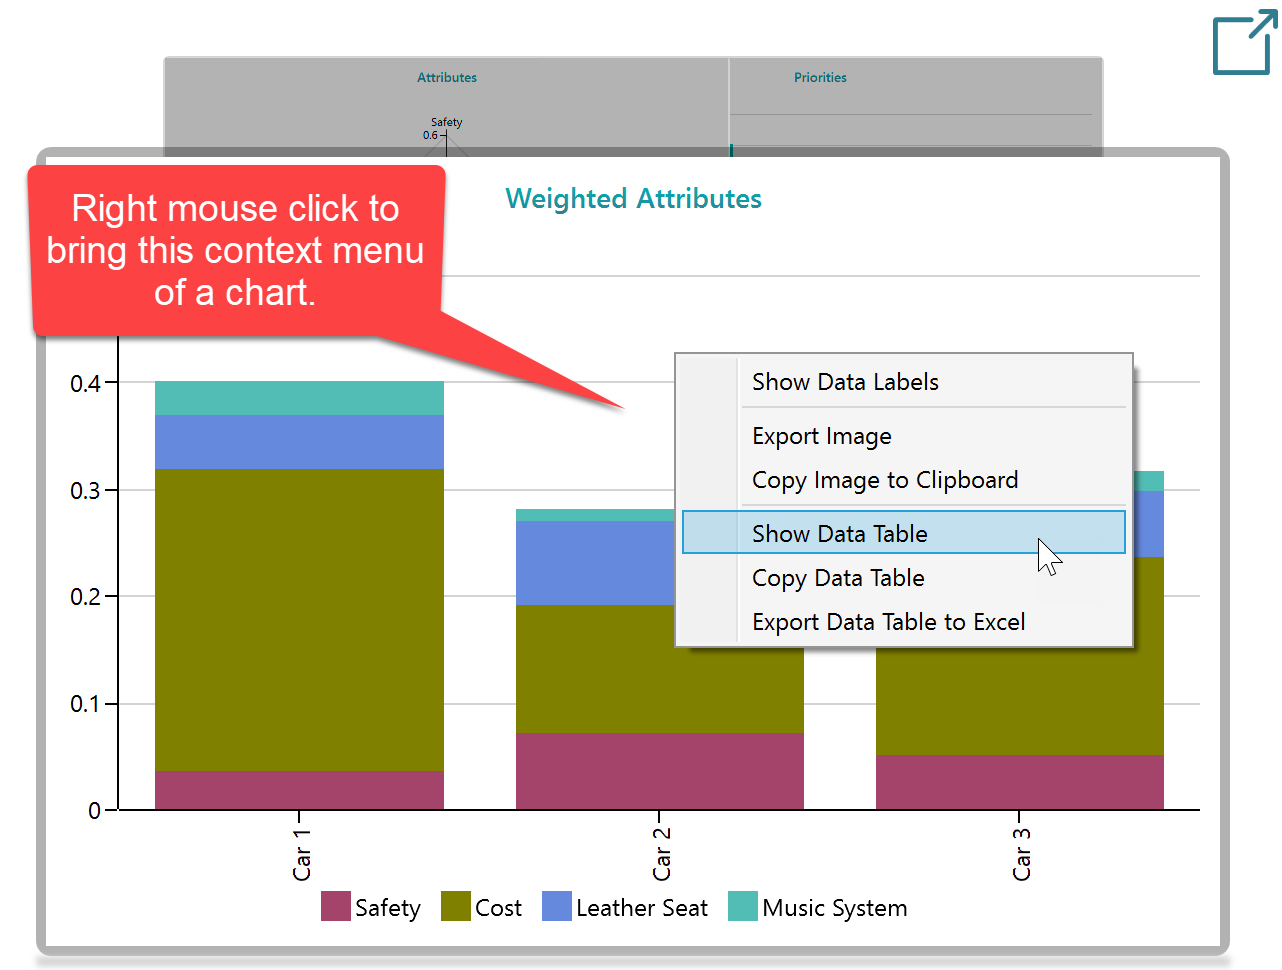
When you choose "Show Data Table", the data appears in a separate grid window. From that window, you can export the data table to Excel and use table operations such as sorting and filtering.
Sensitivity Analysis Charts
The Sensitivity Analysis panel contains more charts. See the sensitivity analysis documentation for details.