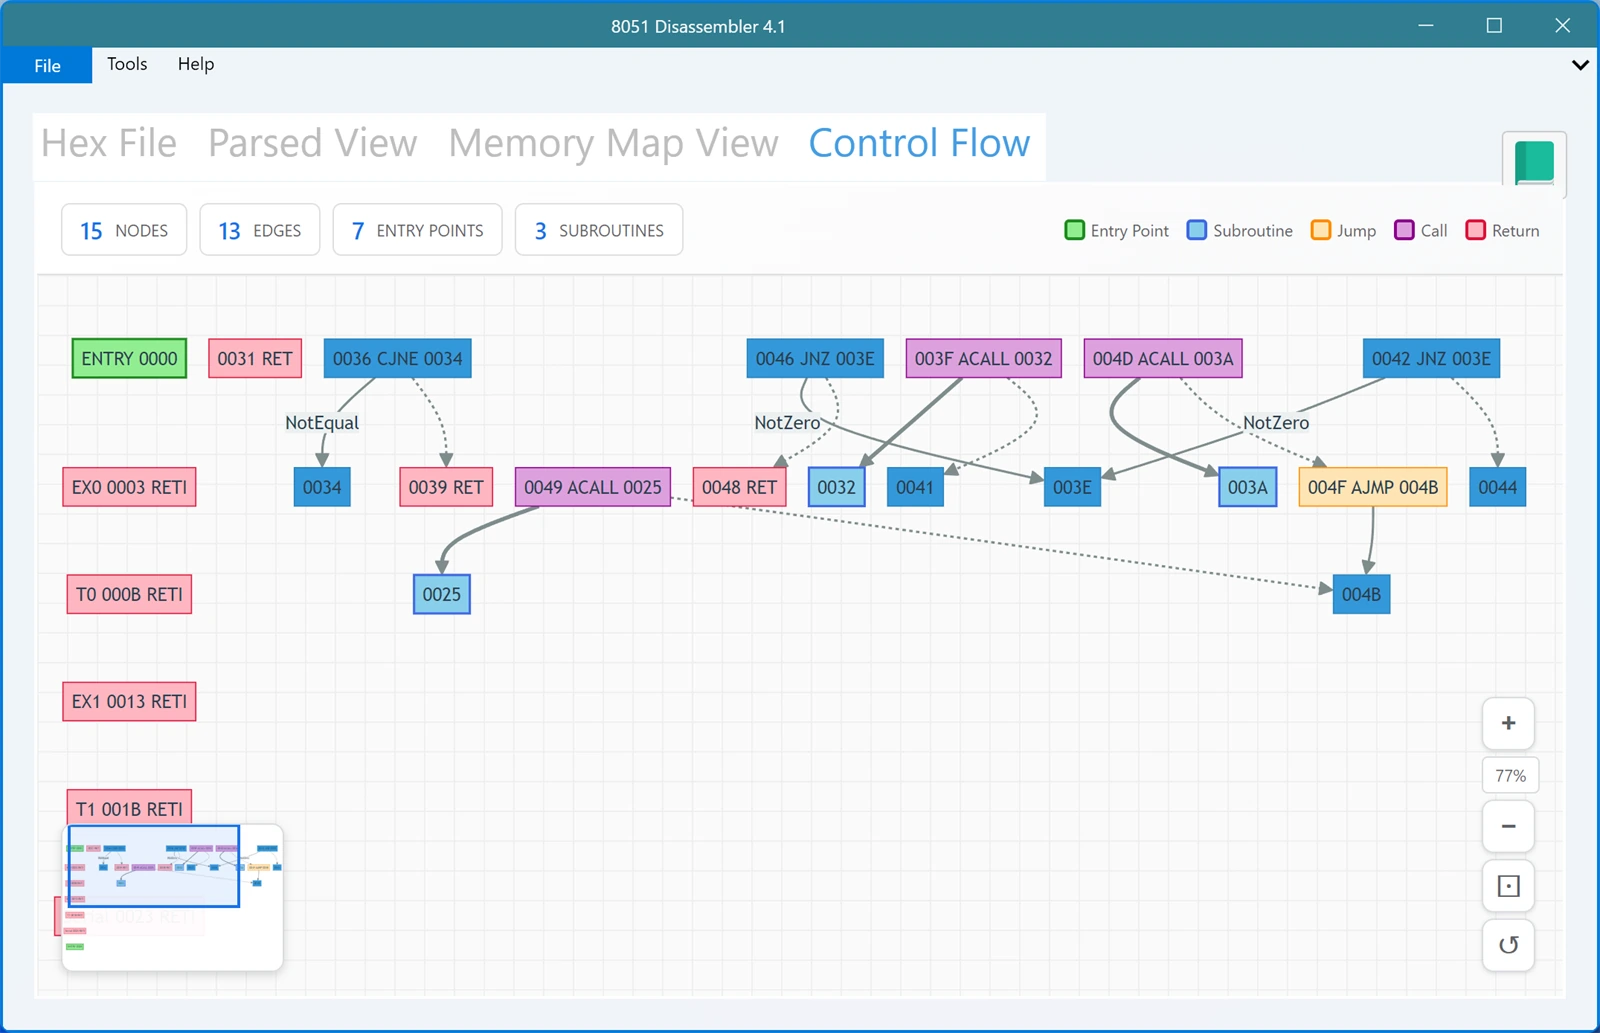


Control Flow graph
A list of instructions tells you what a program contains. It does not tell you how the program moves. The Control Flow tab answers the second question by drawing your code as a diagram: boxes for the places execution can be, arrows for the ways it can get from one to another.
This is the view that pays off most when you have no source code. Given nothing but a hex file, it shows you where the program starts, which routines call which, and which blocks are handlers that nothing calls directly.
The four counts along the top
Before you read the diagram, the summary bar tells you how big the picture is:
- Nodes, the blocks of code the app found.
- Edges, the connections between them.
- Entry points, the places execution can begin. On the 8051 there is usually more than one, because every interrupt vector is its own entry.
- Subroutines, the blocks that are reached by a call and end in a return.
Reading the colours
The legend sits next to the counts, and each colour means something specific:
- Entry Point in green. Where execution begins, including the reset vector at 0000h.
- Subroutine in blue. A block that is called and returns.
- Jump in orange. A block that transfers control without expecting to come back, for example an AJMP or LJMP.
- Call in purple. A block that calls a subroutine, for example ACALL or LCALL.
- Return in pink. A block that ends the current routine with RET or RETI.
Each box is labelled with its address and the instruction that defines it, so a node reading 003F ACALL 0032 is telling you that at address 003Fh the program calls the routine at 0032h. Interrupt handlers are labelled with the vector name, so EX0 0003 RETI is the external interrupt 0 handler, which in the sample does nothing but return.
Conditional branches
Where a branch depends on a condition, the arrow is labelled with the condition that takes it, such as NotZero for a JNZ or NotEqual for a CJNE. Solid and dotted arrows let you tell the taken path from the fall through path at a glance, which is what you need when you are trying to work out whether a loop can ever exit.
Moving around the diagram
Real programs make large graphs, so the controls on the right let you zoom in and out, reset to a sensible fit, and read the current zoom level. The small overview panel in the corner shows the whole graph with a box marking the part you are looking at, so you can stay oriented while you are zoomed in on one routine.
What the graph is telling you
A few things tend to jump out once you see a program this way. Handlers that sit alone with nothing pointing at them are the interrupt vectors, which is normal. A subroutine with many arrows into it is doing a lot of work for the rest of the program. And a block with no path into it at all is dead code, which is worth knowing when you are trying to make room on a full part.
Because the graph is built from the disassembly, it is only as complete as the code the app could follow. Jumps computed at run time, for example a jump through the accumulator, cannot be resolved from a static file by any tool, so those paths will not appear as arrows.