


Getting Started
Dive into the 8051 Microcontroller's program memory and see how your compiled program hex code resides; - byte by byte. About 8051 Disassembler →
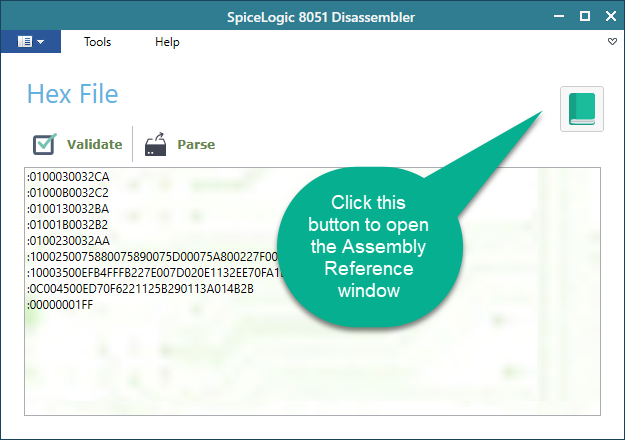
When you open the app for the first time, it does not start empty. A sample piece of hex code is already loaded in the main box, so you can try everything right away without hunting for a file first.
You have three easy ways to get your own code in:
- Keep the sample that is already there and play with it to see how the tool works.
- Open a hex file you already have on your computer.
- Copy your hex code from wherever it lives and paste it straight into the box.
Hex code is the file your C or assembly compiler makes for the 8051. It is the same file you would burn onto the chip. For example, you write your program in C, the compiler turns it into a .hex file, and that file is what you load here. Once it is in the box, you are ready for the next step.
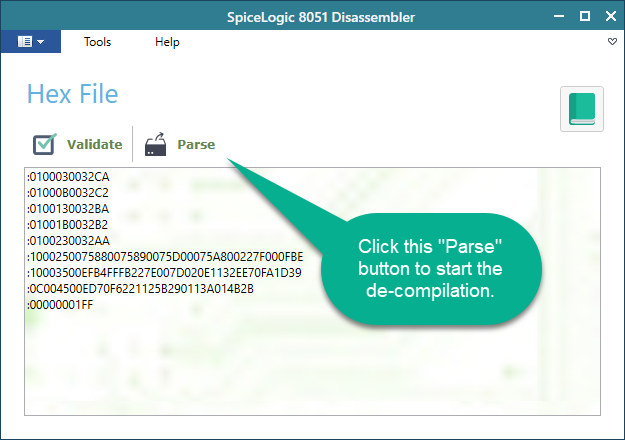
Before you go further, it is a good idea to make sure the code is clean. Click the Validate button and the app checks your hex code for problems. If something is off, you find out now instead of later, after you have spent time looking at the wrong thing.
When the code looks good, click the Parse button. The app reads the hex code, works out what every byte means, and opens two new tabs for you: Memory Map View and Parsed View. Each one shows the same code from a different angle, and both are explained below.
Memory Map View
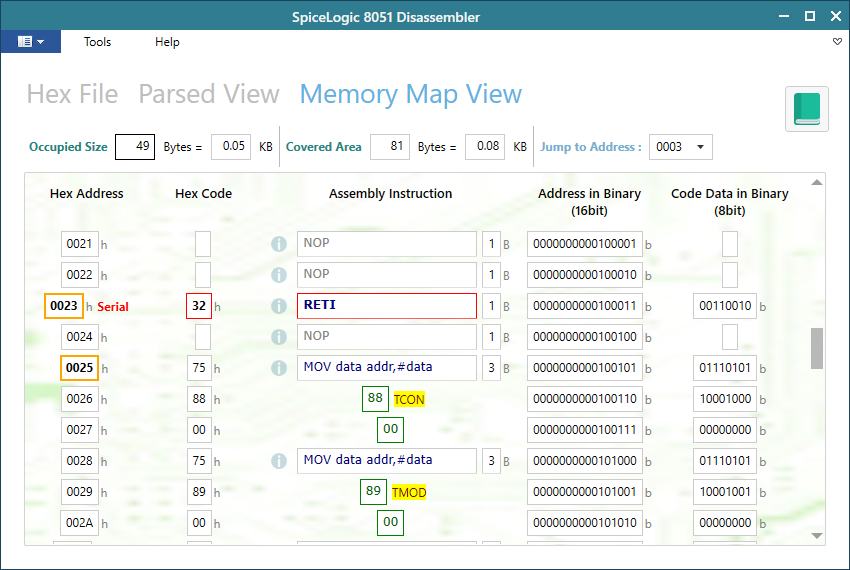
The Memory Map View shows you exactly how your instructions sit inside the chip's code memory. It lists everything by memory address, in order, starting from address 0000.
The handy part is that it does not hide the gaps. Say you have one instruction, then a stretch of empty memory, then the next instruction. This view shows that empty space, so you see the real layout of the chip and not a tidied-up version of it. That matters when you care about where your code actually lands, like checking that an interrupt routine sits at the address the chip jumps to.
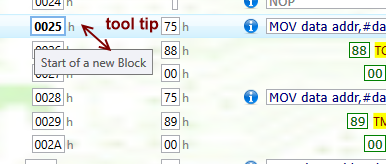
In this view, each byte of machine code is turned back into readable assembly and placed next to its address. You can tell at a glance which bytes are instructions and which bytes are plain data. Hover your mouse over any box and you get more detail, for example whether an address is a Special Function Register or an Interrupt Vector. On top of that, every instruction has a small help icon. Click it and a popup opens, a built-in dictionary of the 8-bit instruction codes, so you can look up what an instruction does without leaving the app.
Parsed View
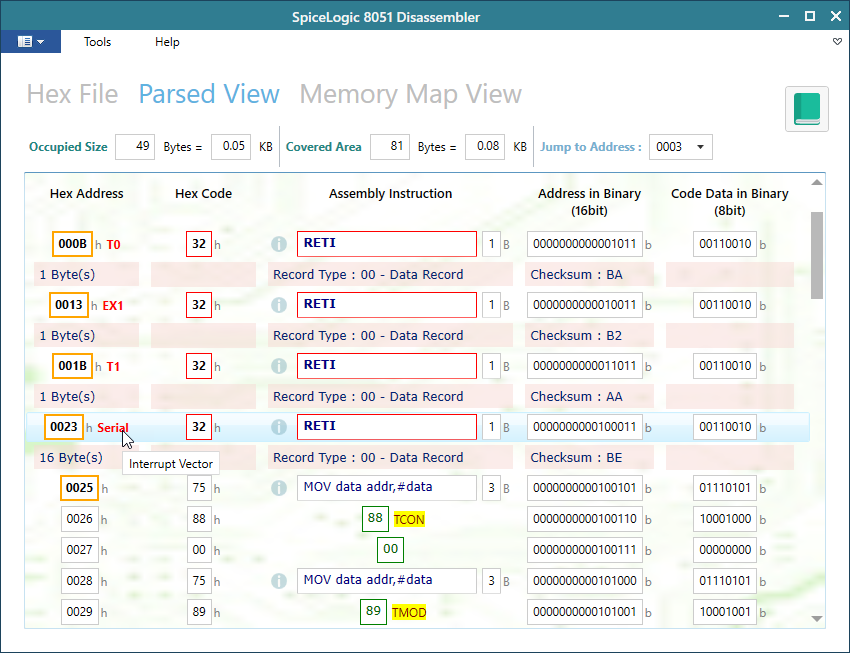
The Parsed View tells you what your hex code means, byte by byte. It looks and works much like the Memory Map View, with the same layout for instructions, data, tooltips, and the reference dictionary. There are two real differences, and they matter once you understand them.
First, the order. The Memory Map View lists everything by memory address, the way the code actually fills up the chip. The Parsed View instead follows the order of your hex code itself, top to bottom, no matter what address each part lands at. So if your hex file starts with an instruction meant for a high memory address and ends with one for a low address, that is exactly the order you see here.
Second, the empty space. The Parsed View skips the gaps. It just disassembles the code straight through, in the order it appears, and shows nothing for memory that is not used.
A simple way to choose between them: use the Parsed View when you want a quick read of what the code does, and use the Memory Map View when you want the full physical picture of how the code sits in memory.
A visual way to learn
Once your hex code is disassembled, the app turns into a quiet teaching tool. You can learn a lot about the microcontroller just by moving your mouse around the screen.
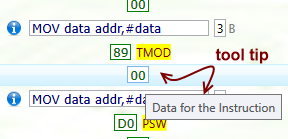
Hover over any item and a tooltip pops up to explain it in plain words. For example, it tells you whether a given byte is an Instruction or plain Data, which is one of the first things you need to sort out when you are reading raw code. Say you are looking at a byte and you are not sure if it runs as code or just holds a number. Point at it and the tooltip says which one it is. This is a friendly way to learn the instruction set, because the explanation comes to you instead of you going to look it up.
Tooltips are not only for the code itself. Hover over an address block and you get a tooltip there too, with details about that address. So as you read down the code, you can check the address on the left and the instruction on the right without opening anything else. It is the same idea applied everywhere. Wherever you point your mouse, the app is ready to tell you what you are looking at, which makes it easy to keep learning while you work instead of stopping to look things up.
Opening the Assembly reference window
After your hex code is disassembled, you will see a small info button next to every assembly mnemonic. Click that info button and the Assembly reference window opens, shown below.
Think of it as having the instruction manual one click away, right next to the line you are reading. Say you hit a mnemonic you do not recognize. Instead of putting the work down to go search for it, you click the info button beside that line and the answer is right there. So you never have to break your train of thought to go find it.
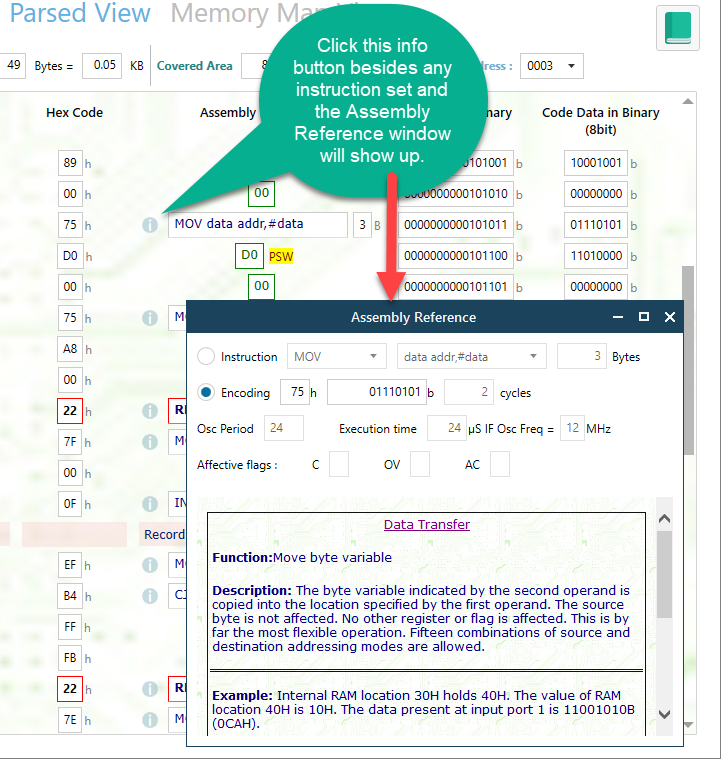
The Assembly reference window gives you the full details of an instruction code: what it does, how it behaves, and the facts you need to make sense of it. You are not limited to the one you clicked either. The window works like a searchable dictionary, so you can look up any other instruction right there in the same place. For example, you open it for one mnemonic, read it, then type in a second one you are curious about without closing the window.
You can also open this reference window on its own, whenever you want to study an instruction, not only when you click the info button beside a line of disassembled code. That makes it handy as a quick lookup even when you do not have a file open.
Wrapping up
The 8051 Disassembler is meant to be simple. If you already know your way around Intel 8051 programming, and you understand that your C or assembly compiler turns your program into hex code for uploading to the chip, then there is almost nothing new to learn about the app itself.
What it gives you is a clear window into that compiler-generated hex code. Instead of staring at rows of raw numbers, you see them laid out, explained, and tied back to the 8051 instruction set. Over time that is a genuinely good way to get comfortable with the 8-bit instructions and to really understand what your code is doing on the chip. Open a hex file, read the views, hover for the details, and the instruction set starts to stick.